In this exercise; we will monitor the core of the OpenShift Cluster. Watch for spikes in memory usage, hard disk space and other cluster stats.

As a learner you will be able to
- View vital stats about the clusters health using Prometheus queries
- Visualise the data on Grafana dashboards
- Overlay log messages to the Grafana dashboards creating a very short feedback loop for Ops and Dev teams.
Name of tool - short description and link to docs or website
From the previous exercise; we introduced app and jenkins monitoring. This exercise focuses on radiation of cluster statistics using Prometheus to scrape metrics and Grafana to display them.
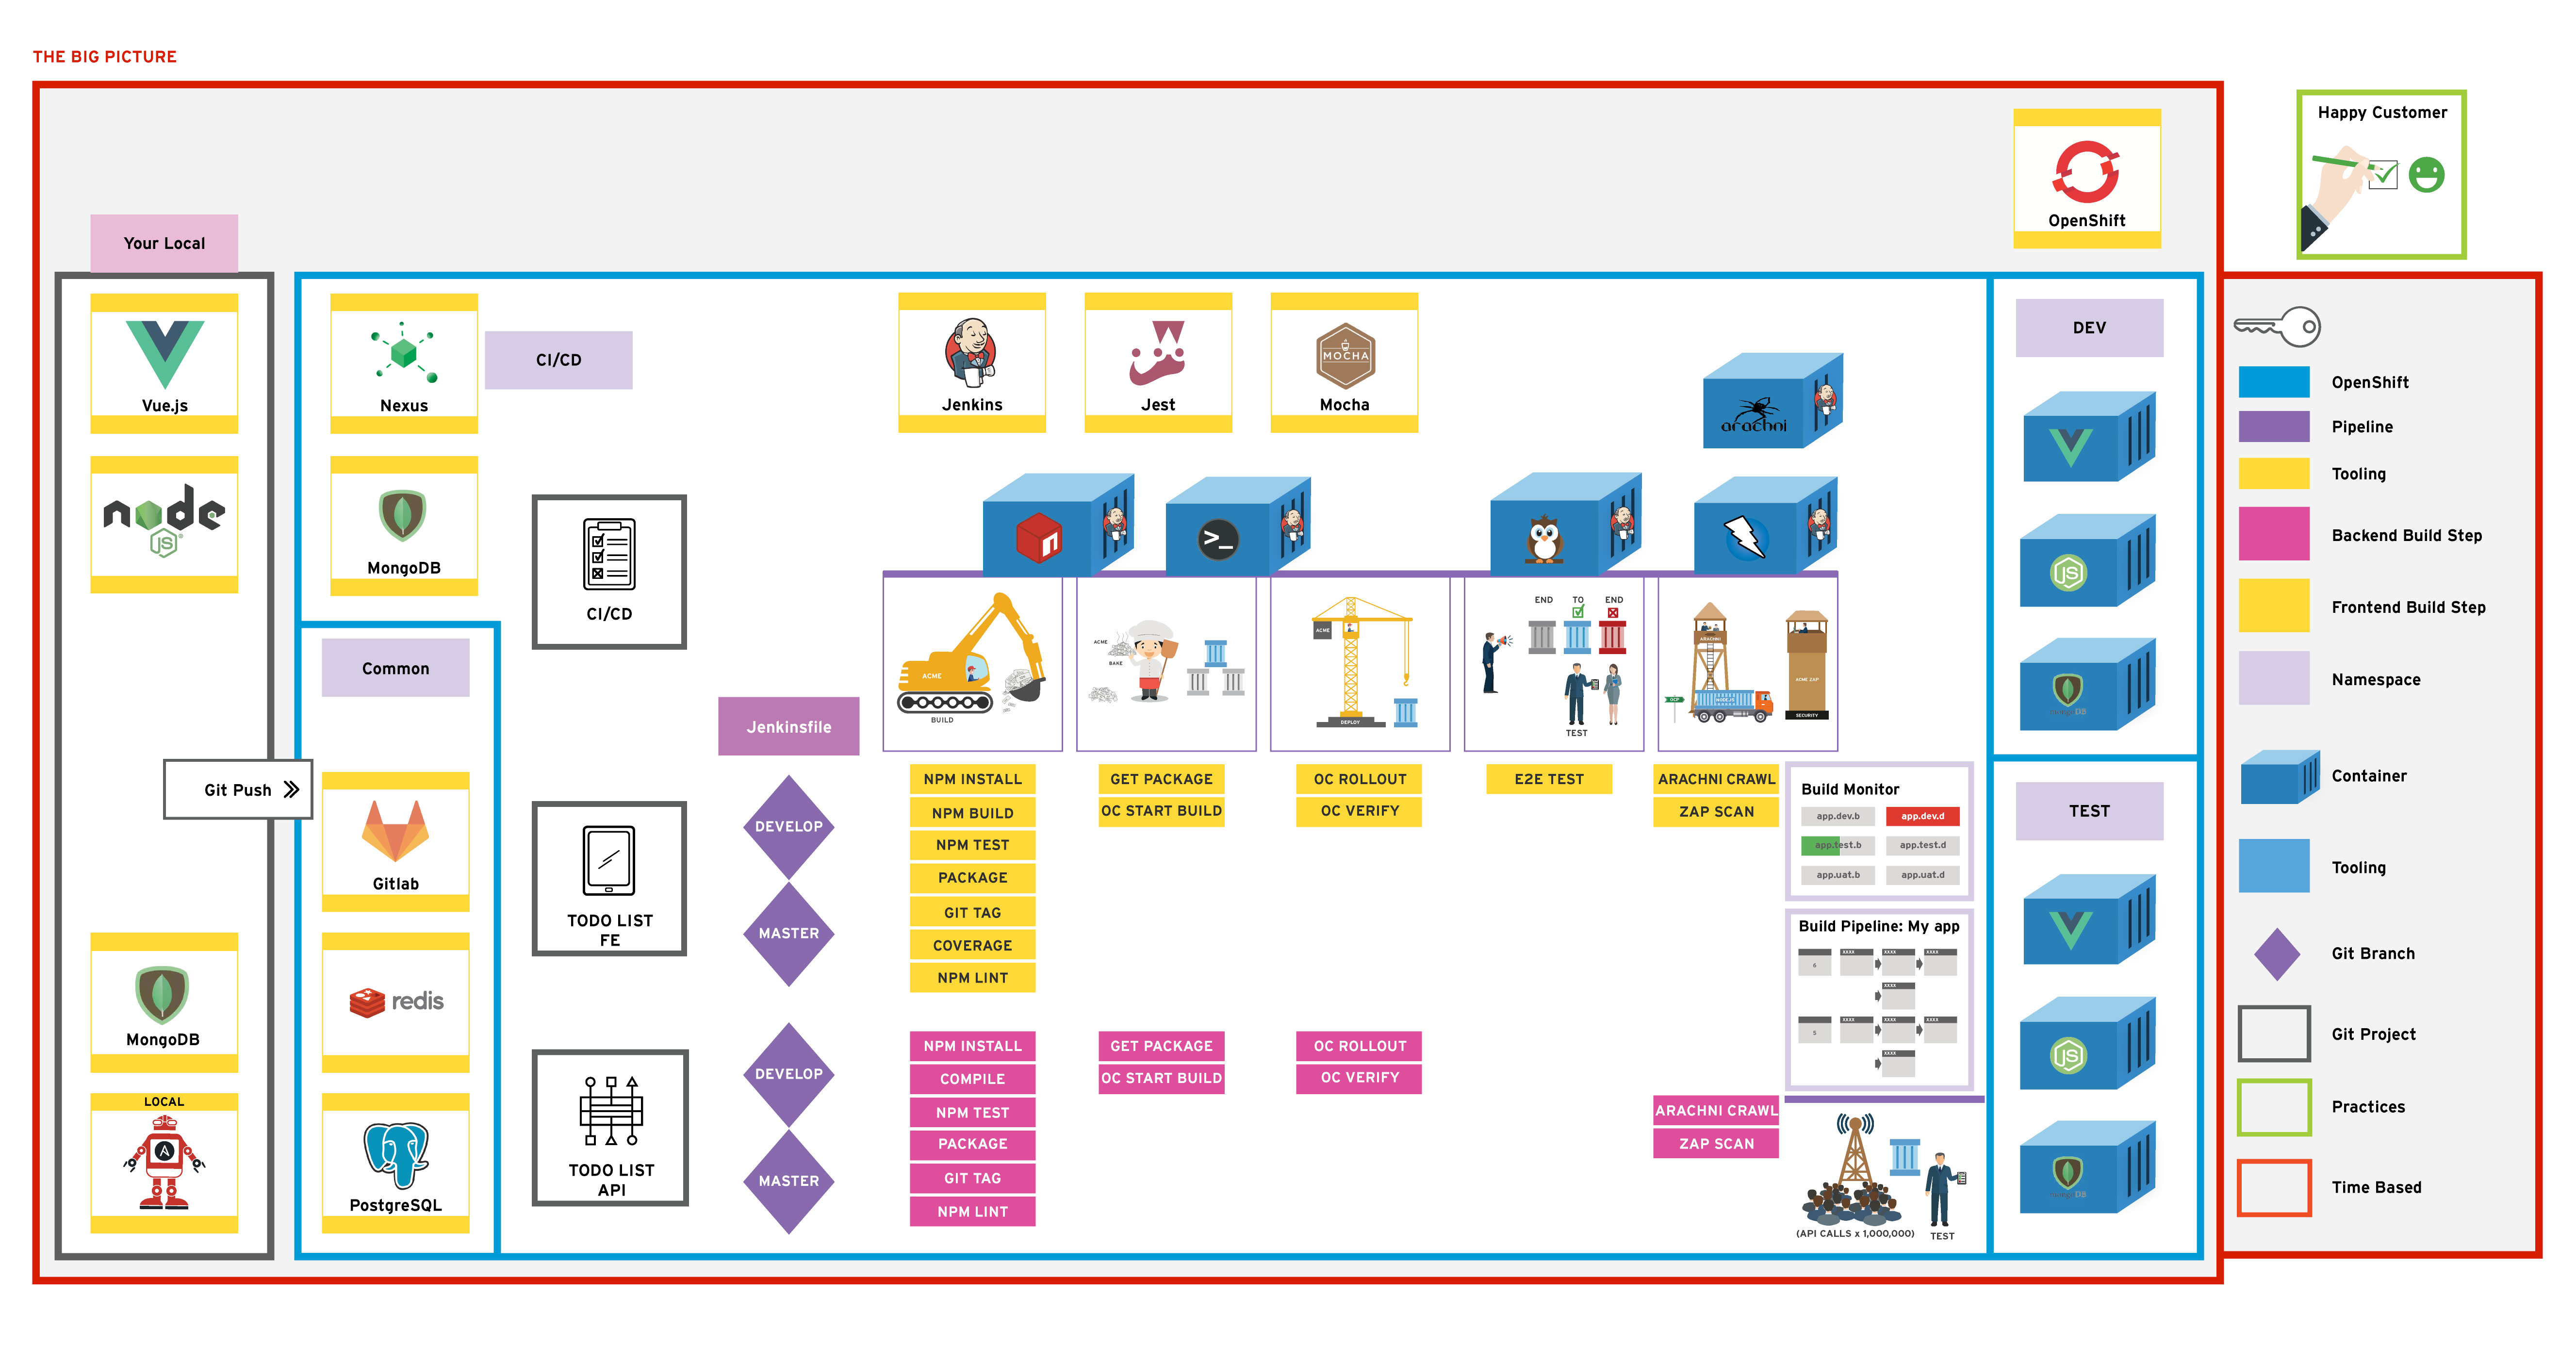
This should contain the goal of the exercise; with enough information that advanced learners could use this to build the exercise without much guidance. The information here
Create a Grafana Dashboard to show key stats of the cluster such as memory usage, remaining disk space etc.
Annotate the graphs by connecting the Elastic Search logs as a datasource in Grafana and running queries through it.
This is a fairly structured guide with references to exact filenames and sections of text to be added. Include pictures and code snippets where appropriate. Over describe why we're doing things
Ideas for go-getters. Advanced topic for doers to get on with if they finish early. These will usually not have a solution and are provided for additional scope.
