| | |
|---|
| | | # The Non-Functionals Strike back |
|---|
| | | > In this exercise we explore the non-functional side of testing. |
|---|
| | | |
|---|
| | |  |
|---|
| | | <!--  --> |
|---|
| | | |
|---|
| | | ## Exercise Intro |
|---|
| | | Non-functional testing provides valuable insights into code quality and application performance. Often overlooked but usually one of the most essential types of testing, non-functional testing types can include, but are not limited to |
|---|
| | |
|---|
| | | > Below is a collection of the new frameworks and tools that will be used in this exercise |
|---|
| | | |
|---|
| | | 1. [eslint](https://eslint.org/) - ESLint is an open source JavaScript linting utility originally created by Nicholas C. Zakas in June 2013. Code linting is a type of static analysis that is frequently used to find problematic patterns or code that doesn’t adhere to certain style guidelines. There are code linters for most programming languages, and compilers sometimes incorporate linting into the compilation process. |
|---|
| | | 1. [Zed Attack Proxy](https://www.owasp.org/index.php/OWASP_Zed_Attack_Proxy_Project) - The OWASP Zed Attack Proxy (ZAP) is one of the world’s most popular free security tools and is actively maintained by hundreds of international volunteers*. It can help you automatically find security vulnerabilities in your web applications while you are developing and testing your applications. Its also a great tool for experienced pentesters to use for manual security testing. |
|---|
| | | 1. [Arachni Crawler](http://www.arachni-scanner.com/) - Arachni is a feature-full, modular, high-performance Ruby framework aimed towards helping penetration testers and administrators evaluate the security of modern web applications. It is free, with its source code public and available for review. It is versatile enough to cover a great deal of use cases, ranging from a simple command line scanner utility, to a global high performance grid of scanners, to a Ruby library allowing for scripted audits, to a multi-user multi-scan web collaboration platform. In addition, its simple REST API makes integration a cinch. |
|---|
| | | 1. [stryker](http://stryker-mutator.io/) - Mutation testing! What is it? Bugs, or mutants, are automatically inserted into your production code. Your tests are run for each mutant. If your tests fail then the mutant is killed. If your tests passed, the mutant survived. The higher the percentage of mutants killed, the more effective your tests are. It's really that simple. |
|---|
| | | <!-- 1. [Zed Attack Proxy](https://www.owasp.org/index.php/OWASP_Zed_Attack_Proxy_Project) - The OWASP Zed Attack Proxy (ZAP) is one of the world’s most popular free security tools and is actively maintained by hundreds of international volunteers*. It can help you automatically find security vulnerabilities in your web applications while you are developing and testing your applications. Its also a great tool for experienced pentesters to use for manual security testing. --> |
|---|
| | | 2. [Arachni Crawler](http://www.arachni-scanner.com/) - Arachni is a feature-full, modular, high-performance Ruby framework aimed towards helping penetration testers and administrators evaluate the security of modern web applications. It is free, with its source code public and available for review. It is versatile enough to cover a great deal of use cases, ranging from a simple command line scanner utility, to a global high performance grid of scanners, to a Ruby library allowing for scripted audits, to a multi-user multi-scan web collaboration platform. In addition, its simple REST API makes integration a cinch. |
|---|
| | | <!-- 1. [stryker](http://stryker-mutator.io/) - Mutation testing! What is it? Bugs, or mutants, are automatically inserted into your production code. Your tests are run for each mutant. If your tests fail then the mutant is killed. If your tests passed, the mutant survived. The higher the percentage of mutants killed, the more effective your tests are. It's really that simple. --> |
|---|
| | | |
|---|
| | | ## Big Picture |
|---|
| | | > From the previous exercise; we introduced pipeline-as-code and new Jenkins Slave nodes. This exercise focuses on extending the pipeline with Non-functional testin and some automated security testing. |
|---|
| | | > In the previous exercise; we introduced pipeline-as-code and new Jenkins Slave nodes. This exercise focuses on extending the pipeline with non-functional testing and some automated security testing. |
|---|
| | | |
|---|
| | |  |
|---|
| | | |
|---|
| | | _____ |
|---|
| | | |
|---|
| | | ## 10,000 Ft View |
|---|
| | | > This lesson will use the Exercise 4's Zap Slave and Arachni scanner to improve the pipeline. Linting will be included in the build and code coverage too. |
|---|
| | | > This lesson will use the Arachni scanner to improve the pipeline. Linting will be included in the build and code coverage too. |
|---|
| | | |
|---|
| | | 2. Add a parallel stage after the e2e tests on the front end to run OWASP Zap and Arachni against the deployed apps. |
|---|
| | | 1. Add a new stage after the e2e tests on the front end to run the Arachni scanner against the deployed apps. |
|---|
| | | |
|---|
| | | 2. Add Code Coverage reporting to the build for gaining greater insight into test improvements. |
|---|
| | | |
|---|
| | | 2. Add `npm run lint` to the Frontend and report the result using the Checkstyle Plugin in Jenkins. |
|---|
| | | 3. Add `npm run lint` to the Frontend and report the result in Jenkins. |
|---|
| | | |
|---|
| | | 2. Create a new Jenkins job to run some light performance testing against the API layer using the perf tests tasks. |
|---|
| | | 4. Create a new Jenkins job to run some light performance testing against the API layer using the perf tests tasks. |
|---|
| | | |
|---|
| | | ## Step by Step Instructions |
|---|
| | | > This is a well structured guide with references to exact filenames and indications as to what should be done. |
|---|
| | | <!-- > This is a well structured guide with references to exact filenames and indications as to what should be done. --> |
|---|
| | | |
|---|
| | | ### Part 1 - Add Security scanning to the pipeline |
|---|
| | | > _In this exercise the first of our non-functional testing is explored in the form of some security scanning. We will add the scans to our Jenkinsfile and have them run as new stages_ |
|---|
| | | > _In this exercise, the first of our non-functional testing is explored in the form of some security scanning. We will add the scan to our Jenkinsfile and have them run as a new stage_ |
|---|
| | | |
|---|
| | | 2. Open the `todolist-fe` application's `Jenkinsfile` in your favourite editor. The file is stored in the root of the project. |
|---|
| | | 1. Open the `todolist-fe` application's `Jenkinsfile` in your favourite editor. The file is stored in the root of the project. Ensure that you using the `master` branch of `todolist-fe` |
|---|
| | | ```bash |
|---|
| | | cd todolist-fe |
|---|
| | | git checkout master |
|---|
| | | ``` |
|---|
| | | |
|---|
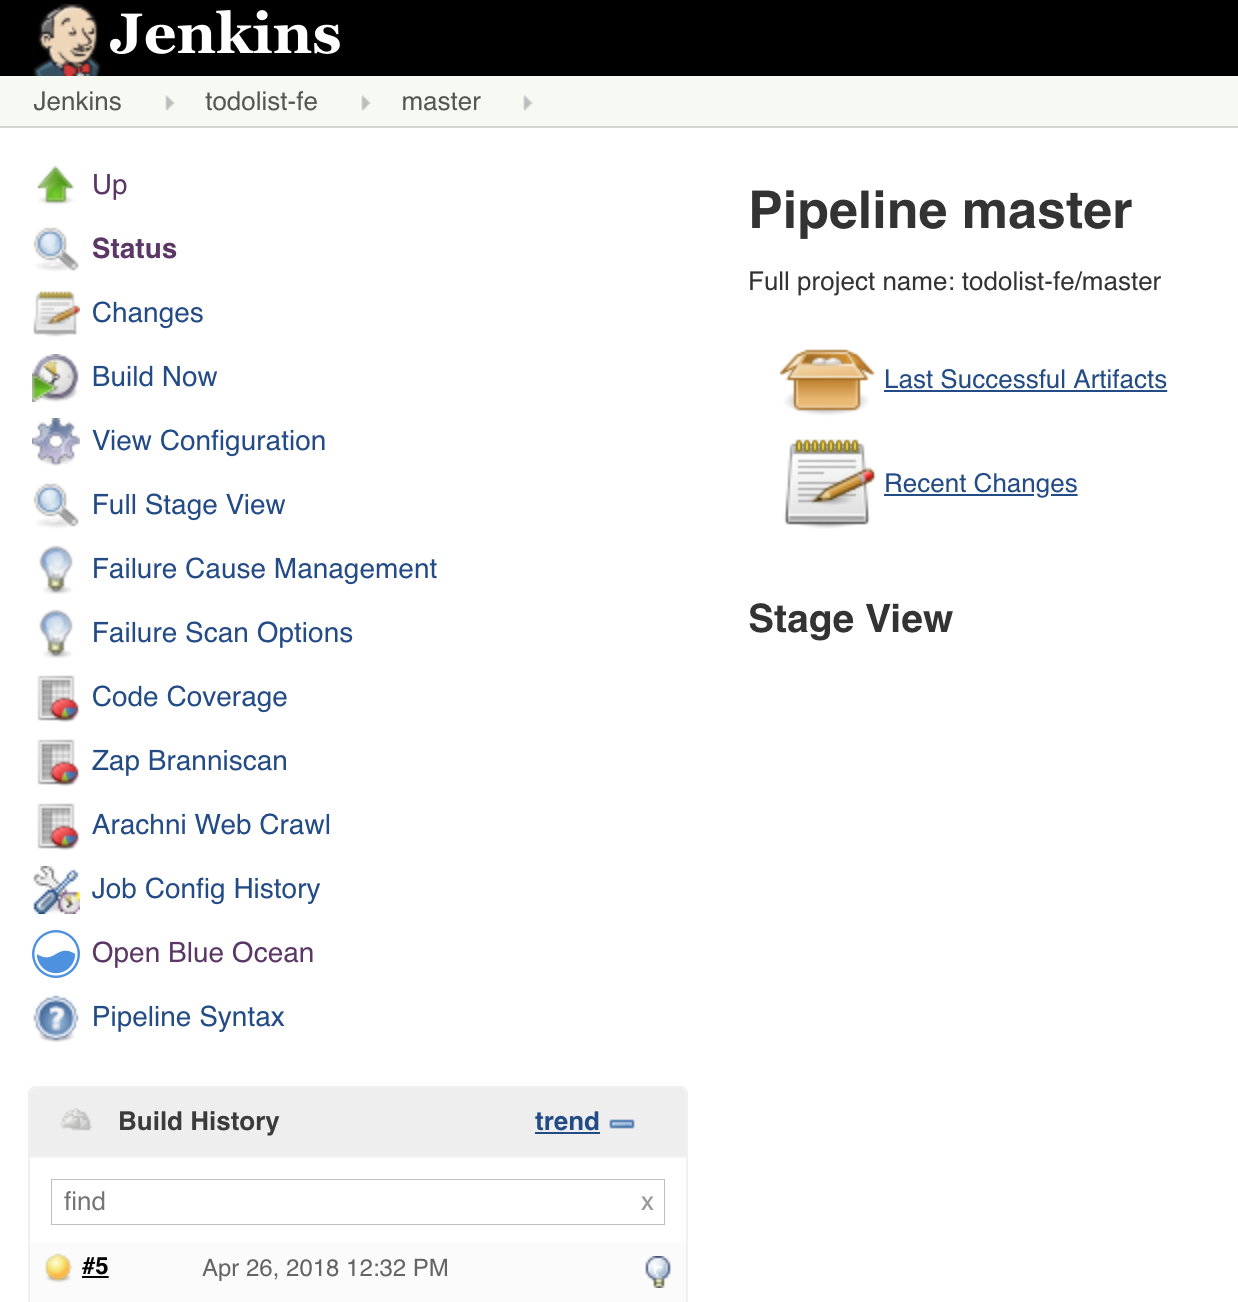
| | | 2. The file is laid out with a collection of stages that correspond to each part of our build as seen below. We will create a new stage to execute in parallel. |
|---|
| | | 2. The file is laid out with a collection of stages that correspond to each part of our build as seen below. We will create a new stage to for the Arachni scan. |
|---|
| | |  |
|---|
| | | |
|---|
| | | 2. Create a new Parallel Stage called `security scanning` underneath the `stage("e2e test") { }` section as shown below. The contents of the `e2e test` have been removed for simplicity. |
|---|
| | | 3. Create a new stage called `Arachni Scan` underneath the `stage("e2e test") { }` section as shown below. The contents of the `e2e test` have been removed for simplicity. |
|---|
| | | ```groovy |
|---|
| | | stage("e2e test") { |
|---|
| | | // ... stuff in here .... |
|---|
| | | } |
|---|
| | | stage("security scanning") { |
|---|
| | | parallel { |
|---|
| | | stage('OWASP Scan') { |
|---|
| | | |
|---|
| | | } |
|---|
| | | stage('Arachni Scan') { |
|---|
| | | |
|---|
| | | } |
|---|
| | | stage('Arachni Scan') { |
|---|
| | | agent { |
|---|
| | | node { |
|---|
| | | label "jenkins-slave-arachni" |
|---|
| | | } |
|---|
| | | } |
|---|
| | | when { |
|---|
| | | expression { GIT_BRANCH ==~ /(.*master|.*develop)/ } |
|---|
| | | } |
|---|
| | | steps { |
|---|
| | | sh ''' |
|---|
| | | /arachni/bin/arachni http://${E2E_TEST_ROUTE} --report-save-path=arachni-report.afr |
|---|
| | | /arachni/bin/arachni_reporter arachni-report.afr --reporter=xunit:outfile=report.xml --reporter=html:outfile=web-report.zip |
|---|
| | | unzip web-report.zip -d arachni-web-report |
|---|
| | | ''' |
|---|
| | | } |
|---|
| | | post { |
|---|
| | | always { |
|---|
| | | junit 'report.xml' |
|---|
| | | publishHTML target: [ |
|---|
| | | allowMissing: false, |
|---|
| | | alwaysLinkToLastBuild: false, |
|---|
| | | keepAll: true, |
|---|
| | | reportDir: 'arachni-web-report', |
|---|
| | | reportFiles: 'index.html', |
|---|
| | | reportName: 'Arachni Web Crawl' |
|---|
| | | ] |
|---|
| | | } |
|---|
| | | } |
|---|
| | | } |
|---|
| | | ``` |
|---|
| | | |
|---|
| | | 2. Let's start filling out the configuration for the OWASP Zap scan first. We will set the label to our slave created in previous exercise and a `when` condition of the master or develop branch. |
|---|
| | | <!-- 2. Let's start filling out the configuration for the OWASP Zap scan first. We will set the label to our slave created in previous exercise and a `when` condition of the master or develop branch. |
|---|
| | | ```groovy |
|---|
| | | stage('OWASP Scan') { |
|---|
| | | agent { |
|---|
| | |
|---|
| | | } |
|---|
| | | } |
|---|
| | | } |
|---|
| | | ``` |
|---|
| | | ``` --> |
|---|
| | | |
|---|
| | | 2. Let's add our Arachni Scan to the second part of the parallel block. The main difference between these sections is Jenkins will report an XML report too for failing the build accordingly. Below is the snippet for the Arachni scanning. |
|---|
| | | ```groovy |
|---|
| | | <!-- 2. Let's add our Arachni Scan to the second part of the parallel block. The main difference between these sections is Jenkins will report an XML report too for failing the build accordingly. Below is the snippet for the Arachni scanning. --> |
|---|
| | | <!-- ```groovy |
|---|
| | | stage('Arachni Scan') { |
|---|
| | | agent { |
|---|
| | | node { |
|---|
| | |
|---|
| | | } |
|---|
| | | } |
|---|
| | | } |
|---|
| | | ``` |
|---|
| | | ``` --> |
|---|
| | | |
|---|
| | | 2. With this config in place run a build on Jenkins. To do this; commit your code (from your terminal): |
|---|
| | | 4. With this config in place, commit your code (from your terminal). Wait for a few minutes until a new build in Jenkins is trigerred: |
|---|
| | | ```bash |
|---|
| | | git add . |
|---|
| | | ``` |
|---|
| | |
|---|
| | | git push |
|---|
| | | ``` |
|---|
| | | |
|---|
| | | 2. Check out the Blue Ocean Jenkins view for how the parallel stage is viewed! |
|---|
| | |  |
|---|
| | | 5. Check out the Blue Ocean Jenkins view for how the new stage is viewed! |
|---|
| | |  |
|---|
| | | |
|---|
| | | 2. Once the Jobs have completed; navigate to the Jobs status and see the scores. You can find the graphs and test reports on overview of the Job. Explore the results! |
|---|
| | | 6. Once the Jobs have completed; navigate to the Jobs status and see the scores. You can find the graphs and test reports on overview of the Job. Explore the results! |
|---|
| | |  |
|---|
| | |  |
|---|
| | | |
|---|
| | | <p class="tip"> |
|---|
| | | NOTE - your build may have failed because of the a security failure but the reports should still be generated, it is OK to proceed with the next exercise! |
|---|
| | | NOTE - your build may have failed, or marked as unstable because of the a security failure but the reports should still be generated, it is OK to proceed with the next exercise! |
|---|
| | | </p> |
|---|
| | | |
|---|
| | | 2. TODO - add solution for failing Security scans! |
|---|
| | | <!-- 2. TODO - add solution for failing Security scans! --> |
|---|
| | | |
|---|
| | | ### Part 2 - Add Code Coverage & Linting to the pipeline |
|---|
| | | > _Let's continue to enhance our pipeline with some non-functional testing. Static code analysis and testing coverage reports can provide a useful indicator on code quality and testing distribution_ |
|---|
| | | |
|---|
| | | 3. Coverage reports are already being generated as part of the tests. We can have Jenkins produce a HTML report showing in detail where our testing is lacking. Open the `todolist-fe` in your favourite editor. |
|---|
| | | 1. Coverage reports are already being generated as part of the tests. We can have Jenkins produce a HTML report showing in detail where our testing is lacking. Open the `todolist-fe` in your favourite editor. |
|---|
| | | |
|---|
| | | 3. Open the `Jenkinsfile` in the root of the project; move to the `stage("node-build"){ ... }` section. In the `post` section add a block for producing a `HTML` report as part of our builds. This is all that is needed for Jenkins to report the coverage stats. |
|---|
| | | 2. Open the `Jenkinsfile` in the root of the project; move to the `stage("node-build"){ ... }` section. In the `post` section add a block for producing a `HTML` report as part of our builds. This is all that is needed for Jenkins to report the coverage stats. |
|---|
| | | ```groovy |
|---|
| | | // Post can be used both on individual stages and for the entire build. |
|---|
| | | post { |
|---|
| | |
|---|
| | | sh 'npm run lint' |
|---|
| | | ``` |
|---|
| | | |
|---|
| | | 3. Save the `Jenkinsfile` and commit it to trigger a build with some more enhancements. |
|---|
| | | 4. Save the `Jenkinsfile` and commit it to trigger a build with some more enhancements. |
|---|
| | | ```bash |
|---|
| | | git add . |
|---|
| | | ``` |
|---|
| | |
|---|
| | | git push |
|---|
| | | ``` |
|---|
| | | |
|---|
| | | 3. When the build has completed; fix the linting errors if there are any and commit your changes. Look in Jenkins log for what the issue might be.... |
|---|
| | | 5. A new Jenkins build is trigerred and the pipeline fails. Look in the Jenkins log for what the issue might be: |
|---|
| | |  |
|---|
| | | |
|---|
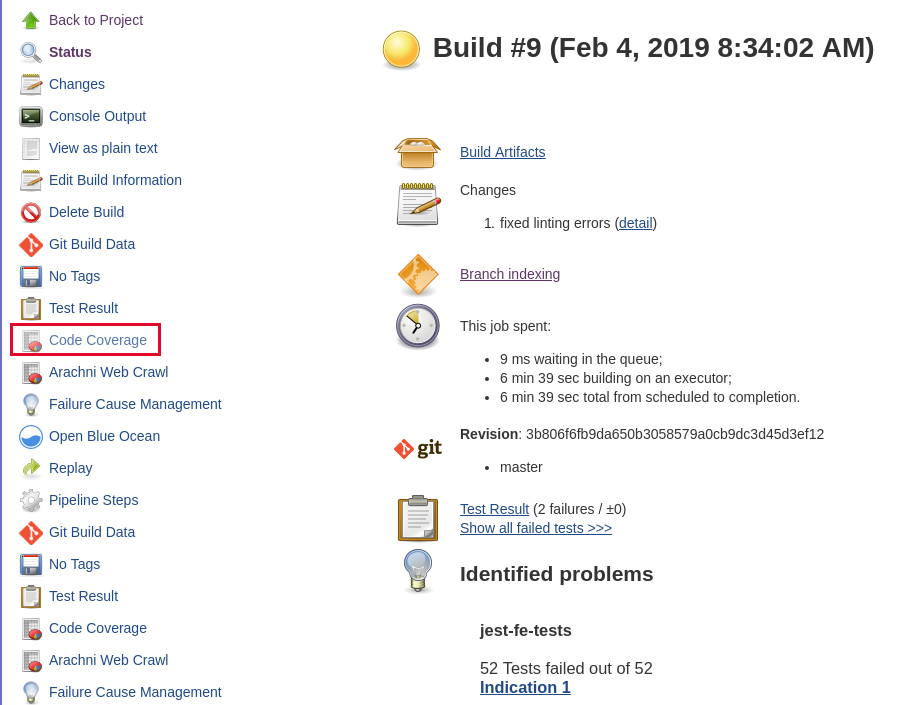
| | | 3. To view the coverage graph; go to the job's build page and open the `Code Coverage` report from the nav bar on the side. |
|---|
| | | <p class="tip"> |
|---|
| | | NOTE - Sometimes this won't display on the `yourjenkins.com/job/todolist-fe/job/branch/` sidebar, click on an individual build in the build history and it should appear on the side navbar. |
|---|
| | | </p> |
|---|
| | | 6. Fix the error identified by the linter by commenting out the offending line. Commit and push your changes to trigger a new build. |
|---|
| | | |
|---|
| | | 7. Once the build passes again, view the coverage graph; go to the job's build page and open the `Code Coverage` report from the nav bar on the side. Sometimes this won't display on the `yourjenkins.com/job/todolist-fe/job/branch/` sidebar, click on an individual build in the build history and it should appear on the side navbar. |
|---|
| | |  |
|---|
| | | |
|---|
| | | 3. Open the report to drill down into detail of where testing coverage could be improved! |
|---|
| | | 8. Open the report to drill down into detail of where testing coverage could be improved! |
|---|
| | |  |
|---|
| | | <p class="tip"> |
|---|
| | | NOTE - a good practice for teams is to try and increase the code coverage metrics over the life of a project. Teams will often start low and use practices such as retrospective to increase the quality at specific times. |
|---|
| | | </p> |
|---|
| | | |
|---|
| | | 3. (Optional Step) - Install the Checkstyle plugin; and add `checkstyle pattern: 'eslint-report.xml'` below the `publishHTML` block to add reporting to Jenkins! |
|---|
| | | <!-- 3. (Optional Step) - Install the Checkstyle plugin; and add `checkstyle pattern: 'eslint-report.xml'` below the `publishHTML` block to add reporting to Jenkins! --> |
|---|
| | | |
|---|
| | | ### Part 3 - Nightly light performance testing |
|---|
| | | > _In this exercise, we will execute the light performance tasks in our API to collect data about throughput time in hopes if the API ever has some `Sam` quality code checked in, we will spot it_ |
|---|
| | | > _In this part of the exercise, we will execute light performance tasks in our API to collect data about throughput time in hopes if the API ever has some `Sam` quality code checked in, we will spot it_ |
|---|
| | | |
|---|
| | | An arbitrary value for the APIs to respond in has been chosen. It is set in the `todolist-api/tasks/perf-test.js` file. In this exercise we will get Jenkins to execute the tests and fail based on the score set there! |
|---|
| | | |
|---|
| | | 4. Create a new Item on Jenkins, `nightly-perf-test` and make it a freestyle job. |
|---|
| | | 1. Create a new Item on Jenkins, `nightly-perf-test` and make it a freestyle job. |
|---|
| | |  |
|---|
| | | |
|---|
| | | 4. Set the `label` on `Restrict where this project can be run` to `jenkins-slave-npm` one used by the build jobs previously. |
|---|
| | | 2. Set the `label` on `Restrict where this project can be run` to `jenkins-slave-npm` one used by the build jobs previously. |
|---|
| | |  |
|---|
| | | |
|---|
| | | 4. In the SCM section; set the project to use the `todolist-api` git project. Set the credentials accordingly. |
|---|
| | | 3. In the SCM section; set the project to use the `todolist-api` git project. Set the credentials accordingly. |
|---|
| | |  |
|---|
| | | |
|---|
| | | 4. Set the build to execute each night; for example 0300 in the morning. Hit `Build periodically` on the Build Triggers section and set it to `H 3 * * *`. |
|---|
| | |  |
|---|
| | | |
|---|
| | | 4. Set the `Color ANSI Console Output` on the Build Environment section. |
|---|
| | | 5. Set the `Color ANSI Console Output` on the Build Environment section. |
|---|
| | | |
|---|
| | | 4. Click `add build step` and select `execute shell` and add the following to it, replacing `<YOUR_NAME>` as expected. We will just test the `create` and `show` API for the moment. We are grabbing the response code of the perf-test to keep Jenkins running both shells steps and then exiting with whichever fails: |
|---|
| | | 6. Click `add build step` and select `execute shell` and add the following to it, replacing `<YOUR_NAME>` as expected. We will just test the `create` and `show` API for the moment. We are grabbing the response code of the perf-test to keep Jenkins running both shells steps and then exiting with whichever fails: |
|---|
| | | ```bash |
|---|
| | | export E2E_TEST_ROUTE=todolist-api-<YOUR_NAME>-dev.<APPS_URL> |
|---|
| | | npm install |
|---|
| | |
|---|
| | | exit $(($rc1 | $rc2)) |
|---|
| | | ``` |
|---|
| | | |
|---|
| | | 4. On the Post Build actions section we will plot the data from the perf tests in Jenkins. Add a `Post-build Action > Plot Build Data`. |
|---|
| | | 7. On the Post Build actions section we will plot the data from the perf tests in Jenkins. Add a `Post-build Action > Plot Build Data`. |
|---|
| | | |
|---|
| | | 4. On the new dialog, name the Plot group e.g. `benchmark-tests` and add `create-api` as the Plot title. Set the `Number of Builds to Include` to a large number like `100`. Set the Data Series file to be `reports/server/perf/create-perf-score.csv` and mark the `Load data from CSV field` checkbox. Apply those changes |
|---|
| | | 8. On the new dialog, name the Plot group e.g. `bench-tests` and add `create-api` as the Plot title. Set the `Number of Builds to Include` to a large number like `100`. Set the Data Series file to be `reports/server/perf/create-perf-score.csv` and mark the `Load data from CSV field` checkbox. Apply those changes |
|---|
| | |  |
|---|
| | | |
|---|
| | | 4. Hit `Add Plot` to add another. Set Plot group to `benchmark-tests` again but this time setting the Plot title to `show-api`. Set the Data Series file to be `reports/server/perf/show-perf-score.csv` and mark the `Load data from CSV` radio button. Save those changes and run the job (Job could take a while to execute!). |
|---|
| | | 9. Hit `Add Plot` to add another. Set Plot group to `bench-tests` again but this time setting the Plot title to `show-api`. Set the Data Series file to be `reports/server/perf/show-perf-score.csv` and mark the `Load data from CSV` radio button. Save those changes and run the job (Job could take a while to execute!). |
|---|
| | | |
|---|
| | | 4. Run it a few times to start to generate the data points on the plot. The `bench-tests` plot is available on the job's homepage |
|---|
| | | 10. Run it a few times to start to generate the data points on the plot. The `bench-tests` plot is available on the job's homepage |
|---|
| | |  |
|---|
| | | |
|---|
| | | _____ |
|---|
| | | |
|---|
| | | ## Extension Tasks |
|---|
| | | <!-- ## Extension Tasks |
|---|
| | | > _Ideas for go-getters. Advanced topic for doers to get on with if they finish early. These will usually not have a solution and are provided for additional scope._ |
|---|
| | | |
|---|
| | | - Enhance the `todolist-api` with the security scanning tools as you've done for the `todolist-api` |
|---|
| | |
|---|
| | | |
|---|
| | | - [Intro](https://docs.google.com/presentation/d/1YQ0hUV3o7DW8O40SiI-BQZXCOSVeQGjo2iTxCL2GZfk/) |
|---|
| | | - [Wrap-up](https://docs.google.com/presentation/d/102hRHDlC9PUIsMs3m1fZy8QUaB5UKzBlhBPdehRWw38/) |
|---|
| | | - [All Material](https://drive.google.com/drive/folders/1seT0V3ABHNonvtFvORNt836NgSeYPuWW) |
|---|
| | | - [All Material](https://drive.google.com/drive/folders/1seT0V3ABHNonvtFvORNt836NgSeYPuWW) --> |
|---|


