In this exercise we explore the non-functional side of testing.
Non-functional testing provides valuable insights into code quality and application performance. Often overlooked but usually one of the most essential types of testing, non-functional testing types can include, but are not limited to
- Performance Testing
- Security testing
- Static Code analysis
- Vulnerability scanning
There are many tools out there for supporting these testing types but often they are left to the end of a delivery. Many traditional projects will leave Performance testing or security sign off to a few weeks before Go Live. This raises the question of what do we do if things do not pass these tests? Do we hold off the Go Live or accept the risk? In most cases we can learn earlier if things will be show stoppers and more importantly we can automate them.
For example; imagine a developer called Sam has checked in some poorly performing function into an API that spikes its response time. Let's call this Sam Code. This Sam Code may not be caught by our Unit Tests but could have very big impact on application usability. Before building code on top this and it becoming more of an issue at the end of a project; we could code and capture metrics around API response time and track these over time and hopefully spot regressions earlier.
Another one of the age old questions is "How do we know we're testing enough?". Well the simple answer is you can never do enough testing! But how do we know we are testing the right things? Code coverage metrics can be run on our application while running the tests. They can identify what files are being tested and a line by line of how many times a test executes against a block of code. Reporting these metrics in our pipeline gives a greater handle on the quality of our testing.
Static code analysis can provide great insights into the quality of the code we've written. By analysing code without executing it bugs and common gotchas can be identified. Code complexity can be assessed using tooling such as SonarQube. Linting of code is a useful thing for non compiled languages such as JavaScript and can be executed in a build to provide some feedback.
Integrating these tools into the developer workflow can greatly improve quality and readability of code. Putting them in the pipeline ensures they are executed - removing the "It works on my machine" view some may take.
As a learner you will be able to
- Create additional Jenkins stages to scan for security vulnerabilities in the Apps
- Assess test quality by producing coverage reports as part of a build
- Improve code readability with linting
- Do some light performance testing to monitor throughput of APIs
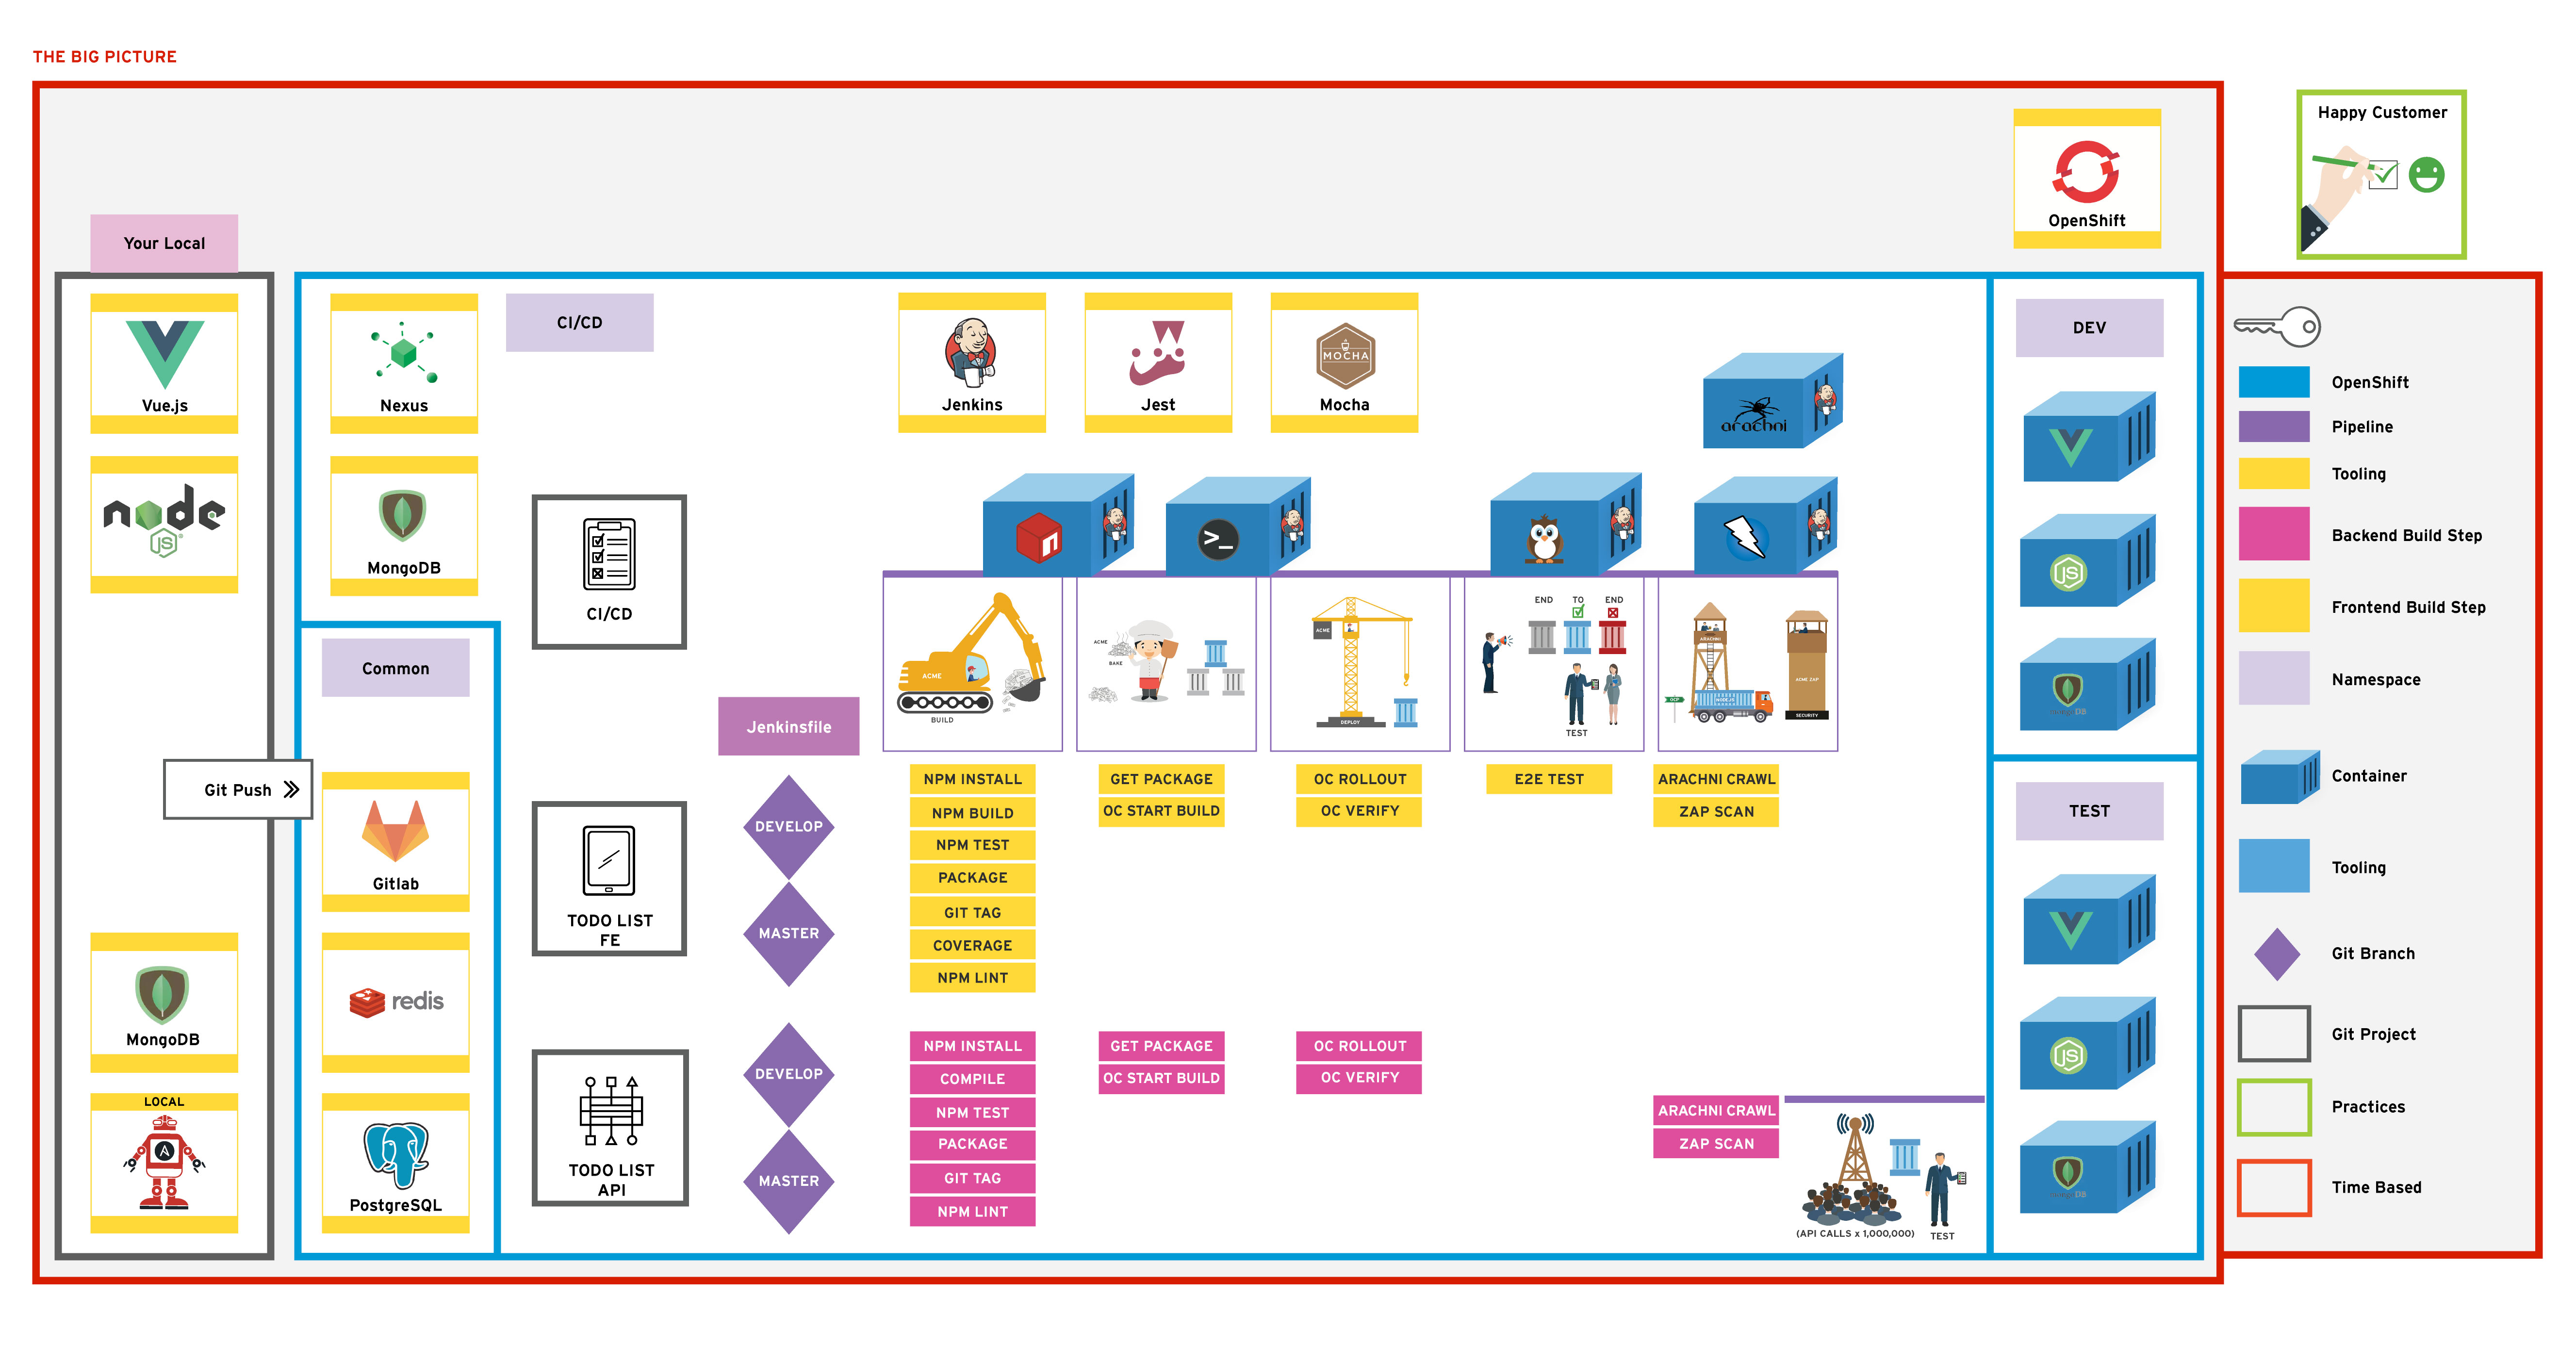
Below is a collection of the new frameworks and tools that will be used in this exercise
In the previous exercise; we introduced pipeline-as-code and new Jenkins Slave nodes. This exercise focuses on extending the pipeline with non-functional testing and some automated security testing.
This lesson will use the Arachni scanner to improve the pipeline. Linting will be included in the build and code coverage too.
Add a new stage after the e2e tests on the front end to run the Arachni scanner against the deployed apps.
Add Code Coverage reporting to the build for gaining greater insight into test improvements.
Add npm run lint to the Frontend and report the result in Jenkins.
Create a new Jenkins job to run some light performance testing against the API layer using the perf tests tasks.
In this exercise, the first of our non-functional testing is explored in the form of some security scanning. We will add the scan to our Jenkinsfile and have them run as a new stage
Open the todolist-fe application's Jenkinsfile in your favourite editor. The file is stored in the root of the project. Ensure that you using the master branch of todolist-febash cd todolist-fe git checkout master
The file is laid out with a collection of stages that correspond to each part of our build as seen below. We will create a new stage to for the Arachni scan.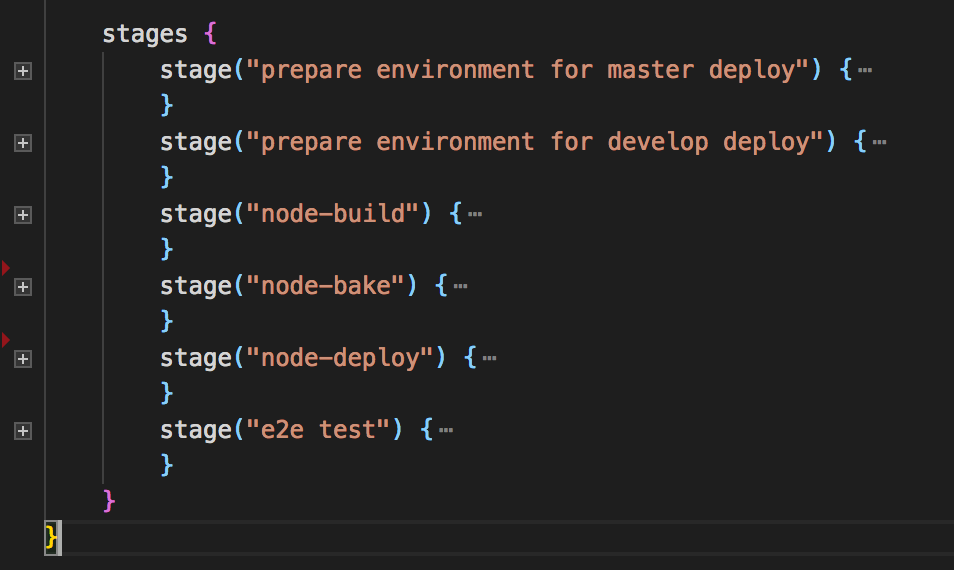
Create a new stage called Arachni Scan underneath the stage("e2e test") { } section as shown below. The contents of the e2e test have been removed for simplicity.groovy stage("e2e test") { // ... stuff in here .... } stage('Arachni Scan') { agent { node { label "jenkins-slave-arachni" } } when { expression { GIT_BRANCH ==~ /(.*master|.*develop)/ } } steps { sh ''' /arachni/bin/arachni http://${E2E_TEST_ROUTE} --report-save-path=arachni-report.afr /arachni/bin/arachni_reporter arachni-report.afr --reporter=xunit:outfile=report.xml --reporter=html:outfile=web-report.zip unzip web-report.zip -d arachni-web-report ''' } post { always { junit 'report.xml' publishHTML target: [ allowMissing: false, alwaysLinkToLastBuild: false, keepAll: true, reportDir: 'arachni-web-report', reportFiles: 'index.html', reportName: 'Arachni Web Crawl' ] } } }
With this config in place, commit your code (from your terminal). Wait for a few minutes until a new build in Jenkins is trigerred:bash git add . bash git commit -m "ADD - security scanning tools to pipeline" bash git push
Check out the Blue Ocean Jenkins view for how the new stage is viewed!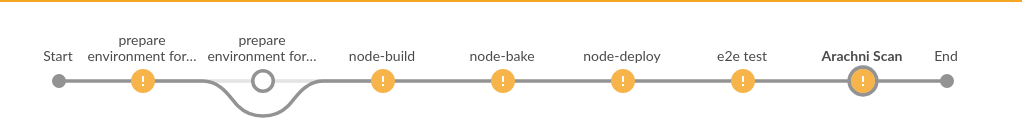
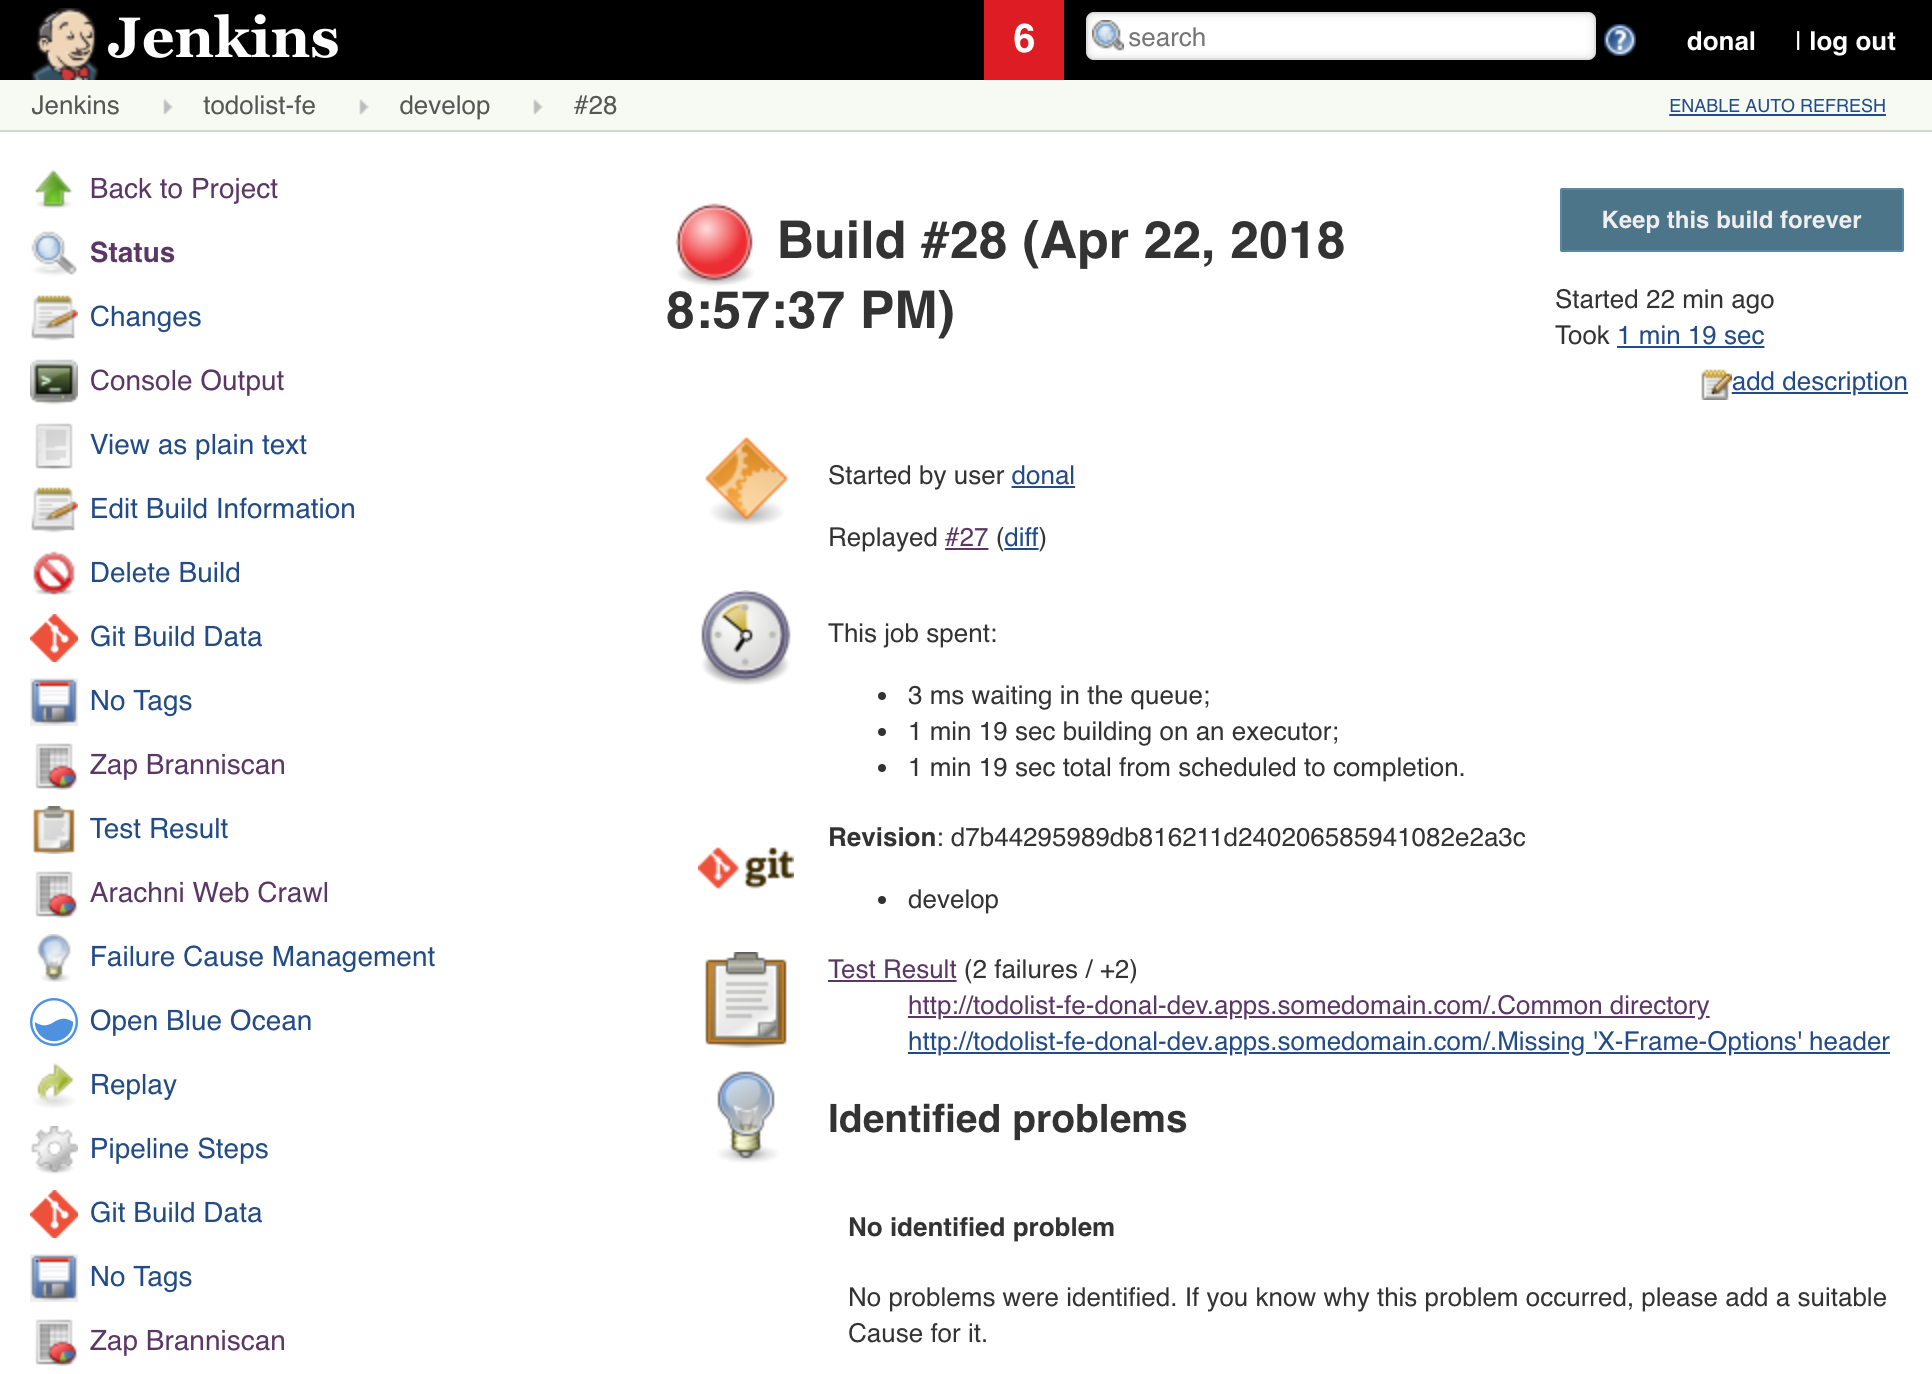
Once the Jobs have completed; navigate to the Jobs status and see the scores. You can find the graphs and test reports on overview of the Job. Explore the results!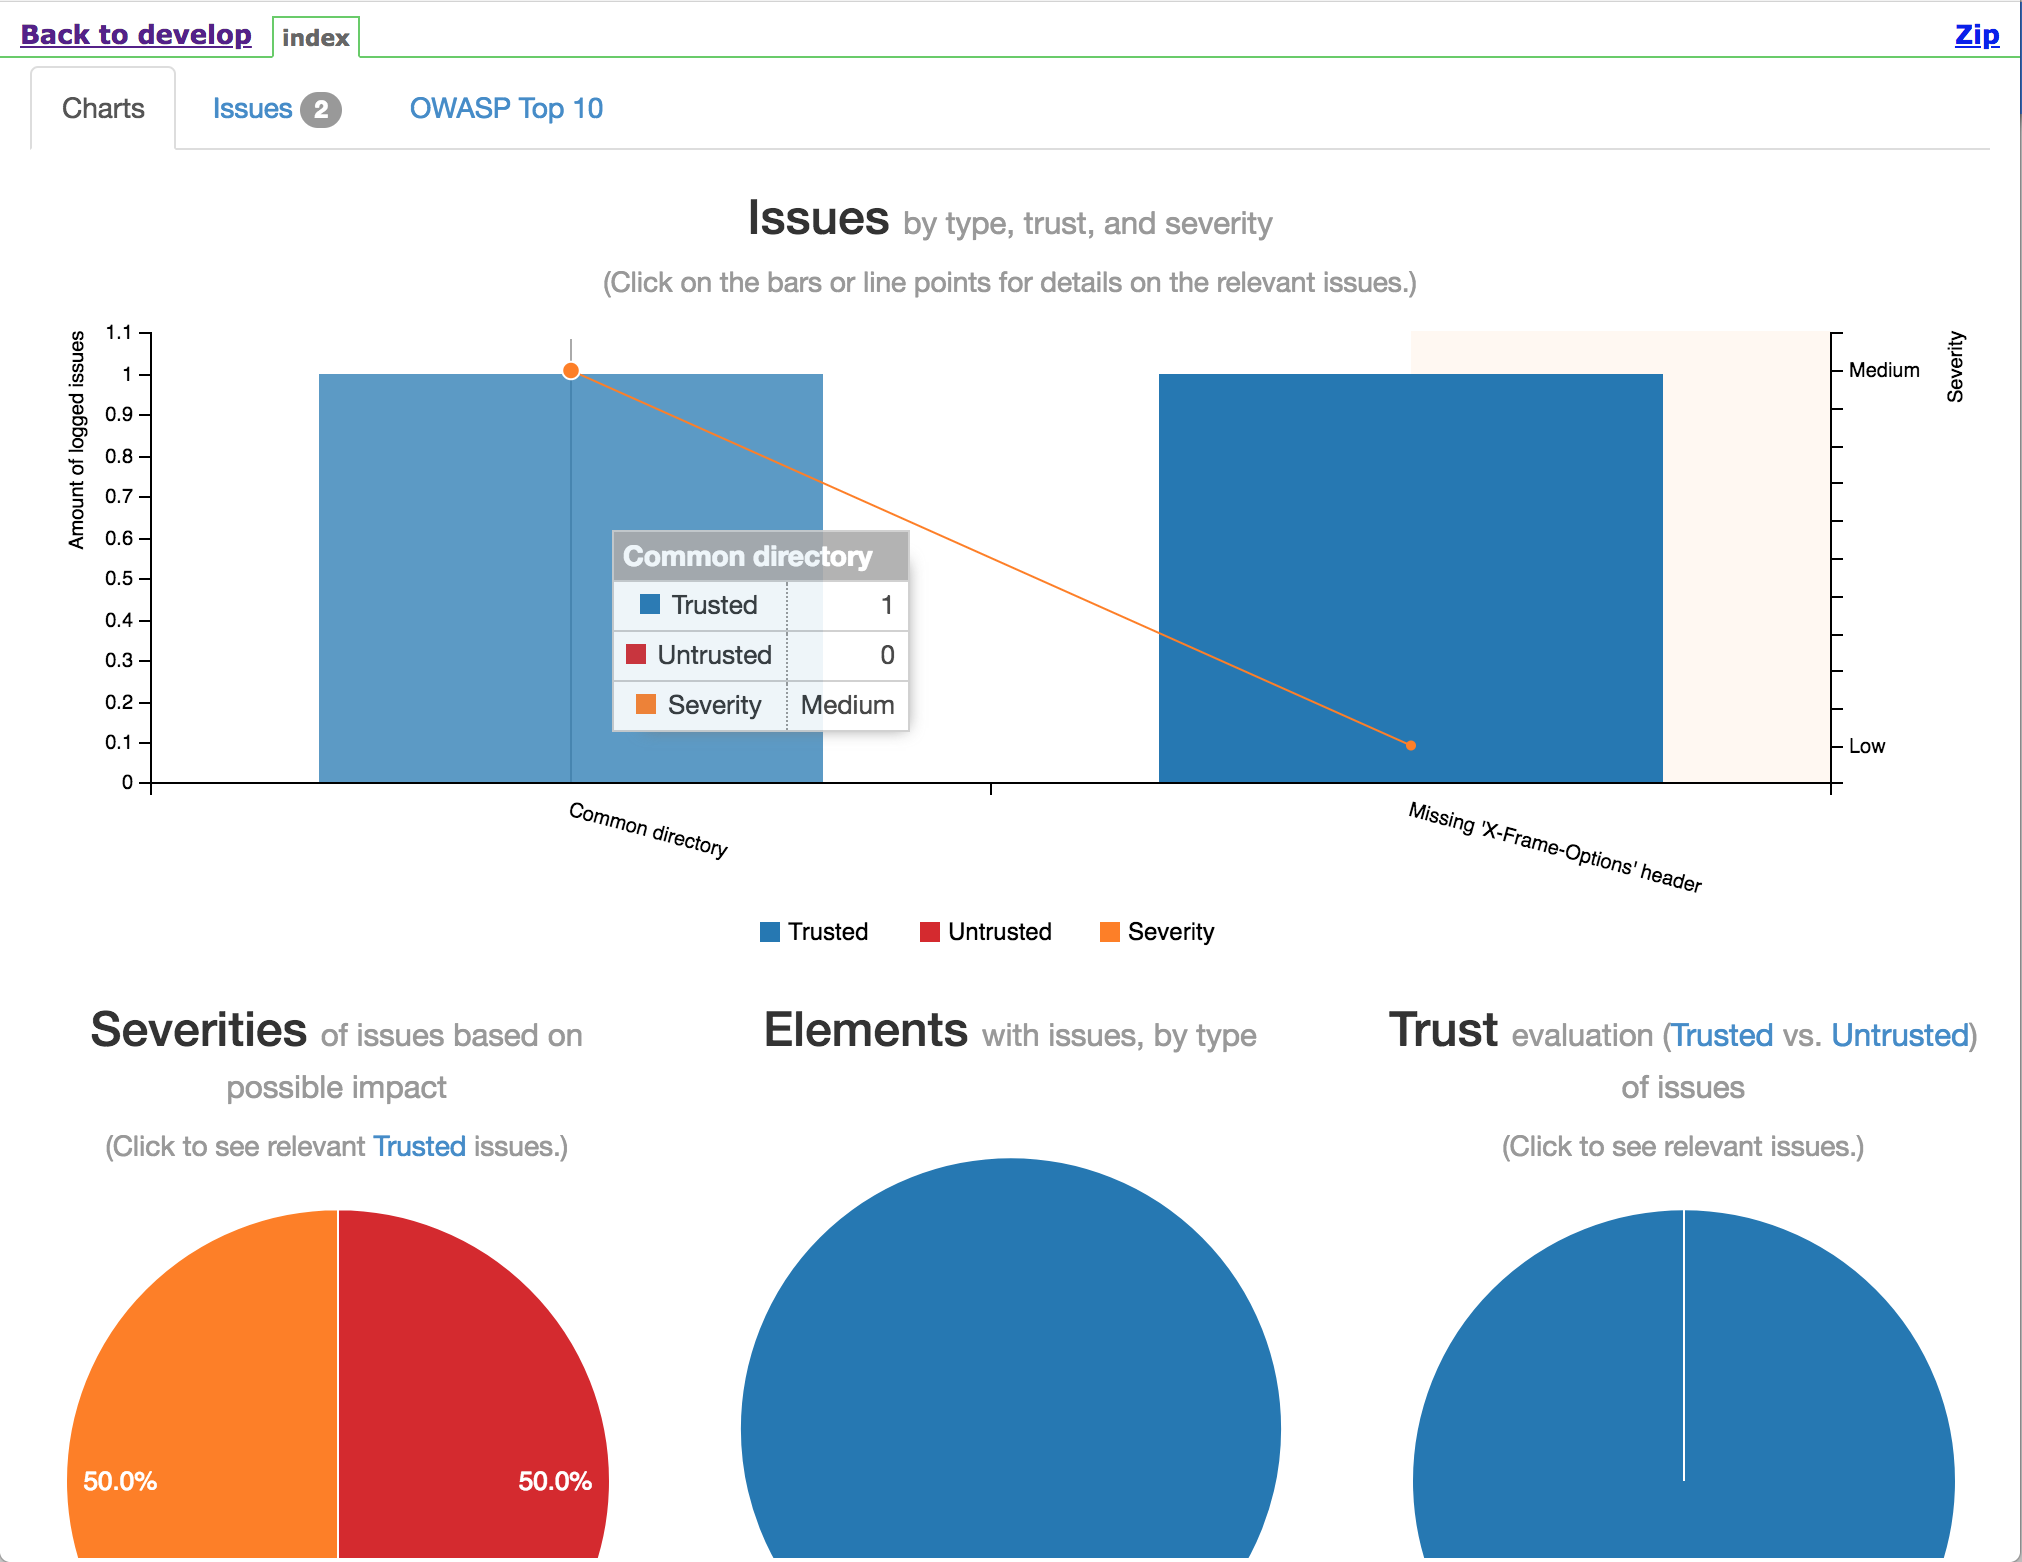
NOTE - your build may have failed, or marked as unstable because of the a security failure but the reports should still be generated, it is OK to proceed with the next exercise!
Let's continue to enhance our pipeline with some non-functional testing. Static code analysis and testing coverage reports can provide a useful indicator on code quality and testing distribution
Coverage reports are already being generated as part of the tests. We can have Jenkins produce a HTML report showing in detail where our testing is lacking. Open the todolist-fe in your favourite editor.
Open the Jenkinsfile in the root of the project; move to the stage("node-build"){ ... } section. In the post section add a block for producing a HTML report as part of our builds. This is all that is needed for Jenkins to report the coverage stats.groovy // Post can be used both on individual stages and for the entire build. post { always { archive "**" junit 'test-report.xml' // publish html publishHTML target: [ allowMissing: false, alwaysLinkToLastBuild: false, keepAll: true, reportDir: 'reports/coverage', reportFiles: 'index.html', reportName: 'Code Coverage' ] }
To get the linting working; we will add a new step to our stage("node-build"){ } section to lint the JavaScript code. Continuing in the Jenkinsfile, After the npm install; add a command to run the linting.groovy echo '### Install deps ###' sh 'npm install' echo '### Running linting ###' sh 'npm run lint'
Save the Jenkinsfile and commit it to trigger a build with some more enhancements.bash git add . bash git commit -m "ADD - linting and coverage to the pipeline" bash git push
A new Jenkins build is trigerred and the pipeline fails. Look in the Jenkins log for what the issue might be: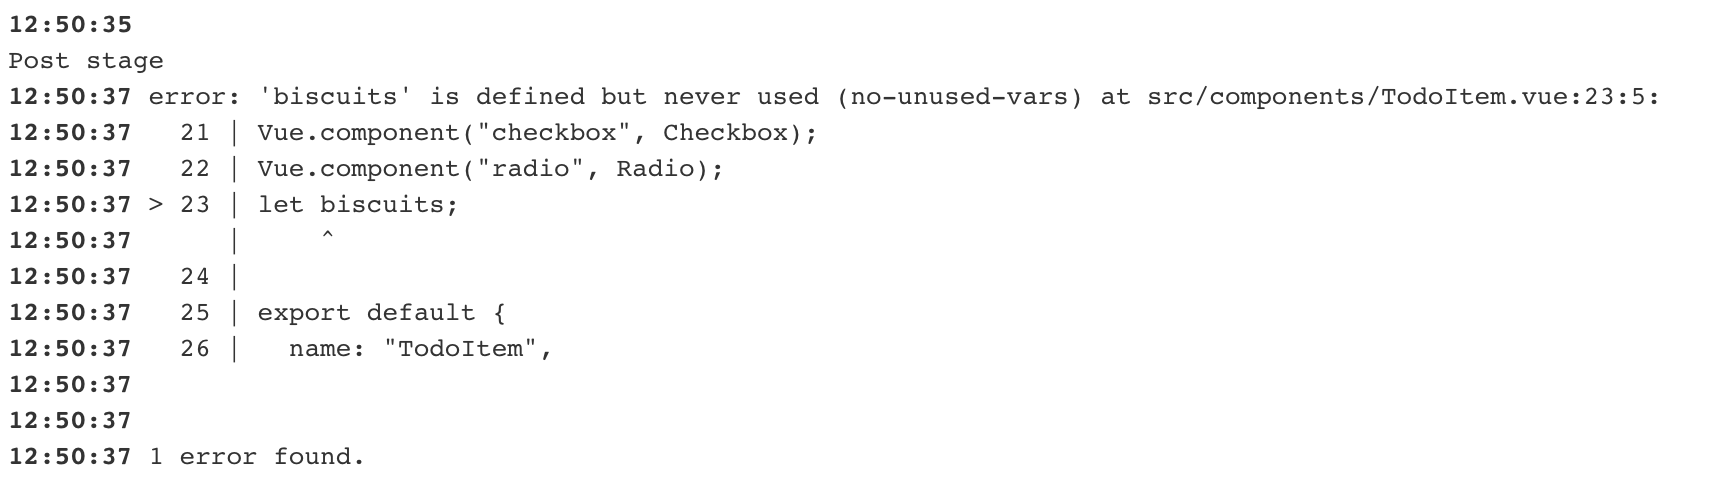
Fix the error identified by the linter by commenting out the offending line. Commit and push your changes to trigger a new build.
Once the build passes again, view the coverage graph; go to the job's build page and open the Code Coverage report from the nav bar on the side. Sometimes this won't display on the yourjenkins.com/job/todolist-fe/job/branch/ sidebar, click on an individual build in the build history and it should appear on the side navbar.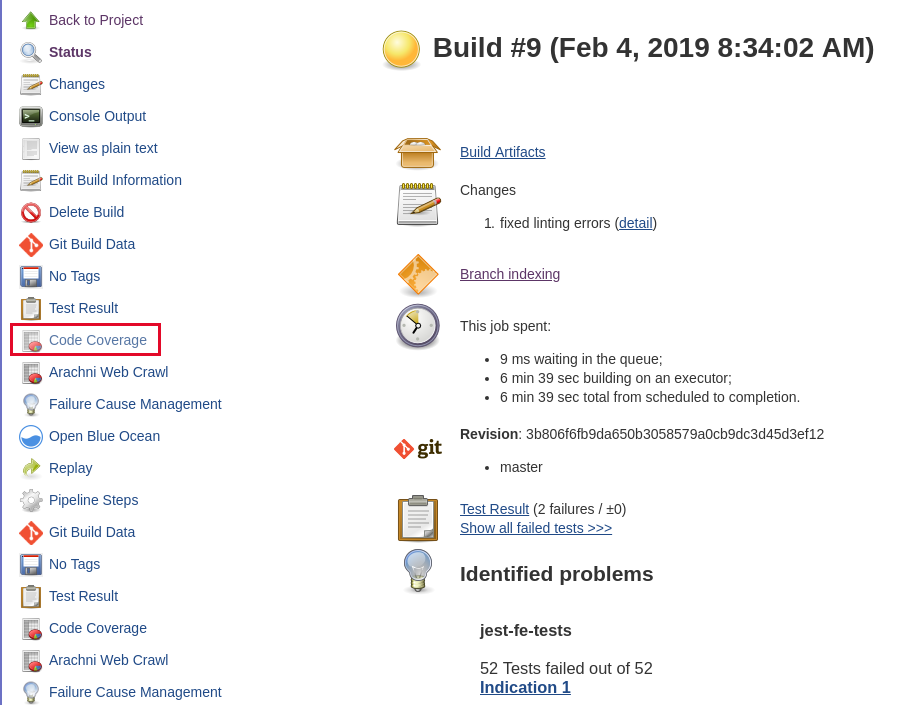
Open the report to drill down into detail of where testing coverage could be improved!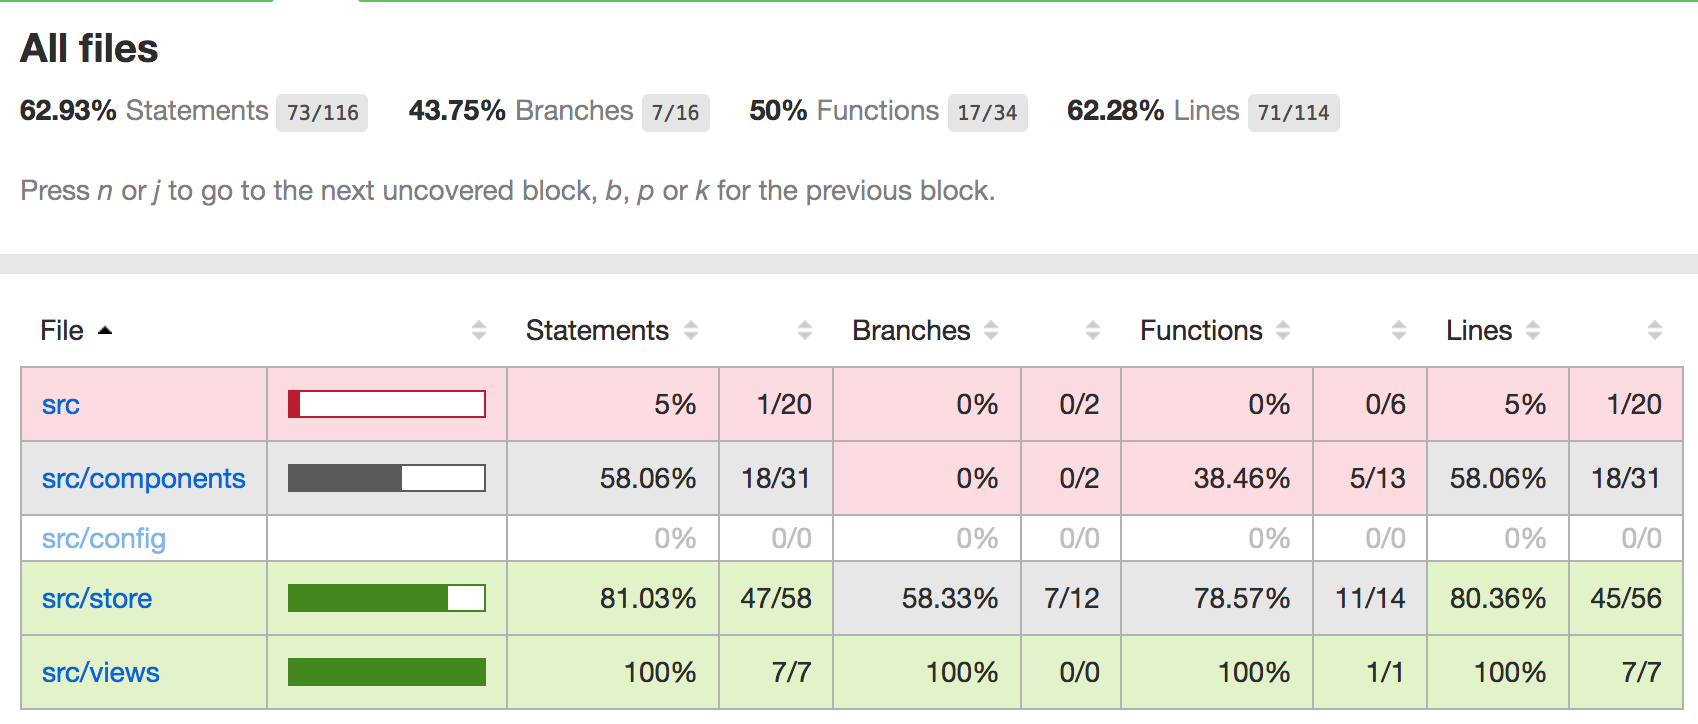
NOTE - a good practice for teams is to try and increase the code coverage metrics over the life of a project. Teams will often start low and use practices such as retrospective to increase the quality at specific times.
In this part of the exercise, we will execute light performance tasks in our API to collect data about throughput time in hopes if the API ever has some
Samquality code checked in, we will spot it
An arbitrary value for the APIs to respond in has been chosen. It is set in the todolist-api/tasks/perf-test.js file. In this exercise we will get Jenkins to execute the tests and fail based on the score set there!
Create a new Item on Jenkins, nightly-perf-test and make it a freestyle job.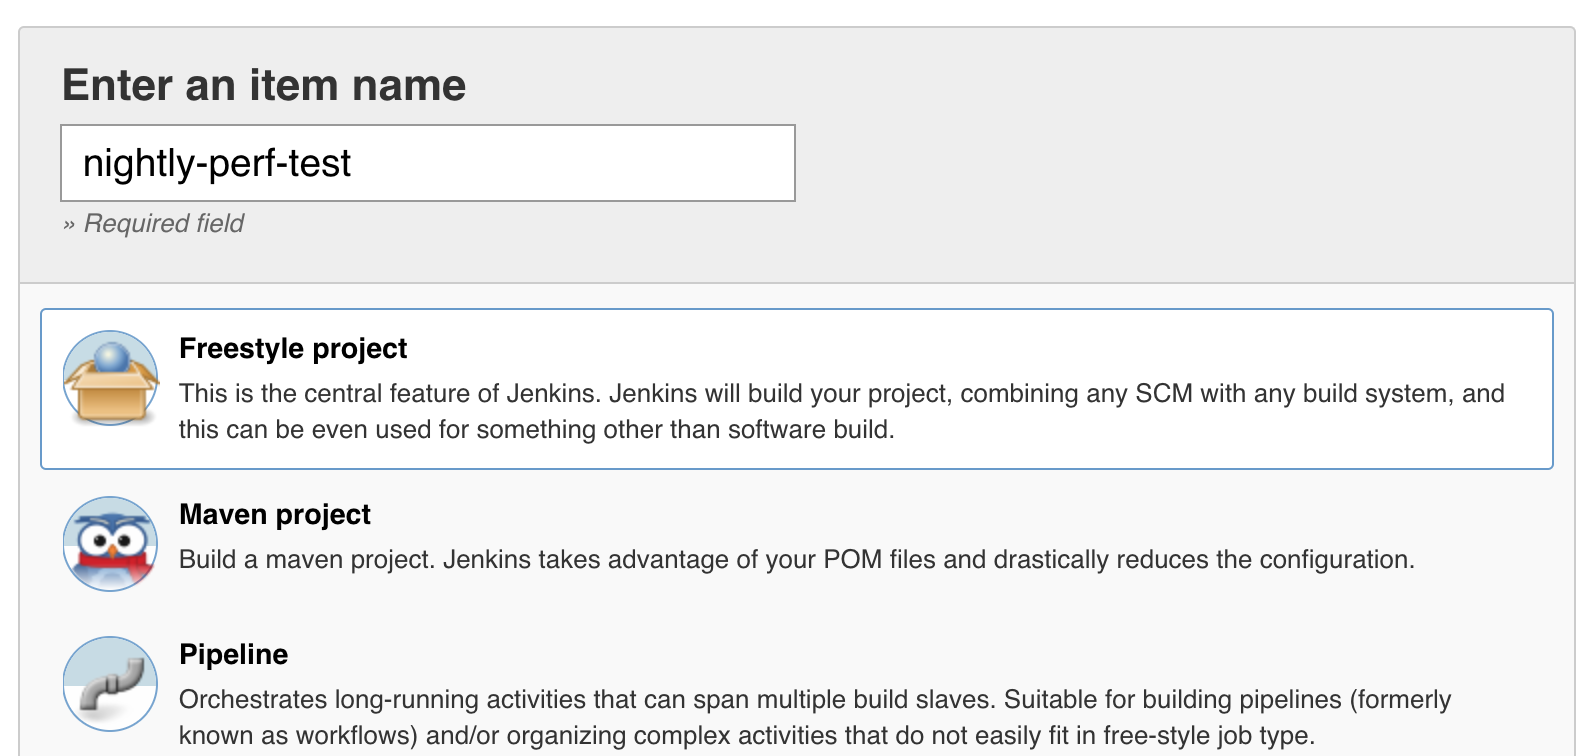
Set the label on Restrict where this project can be run to jenkins-slave-npm one used by the build jobs previously.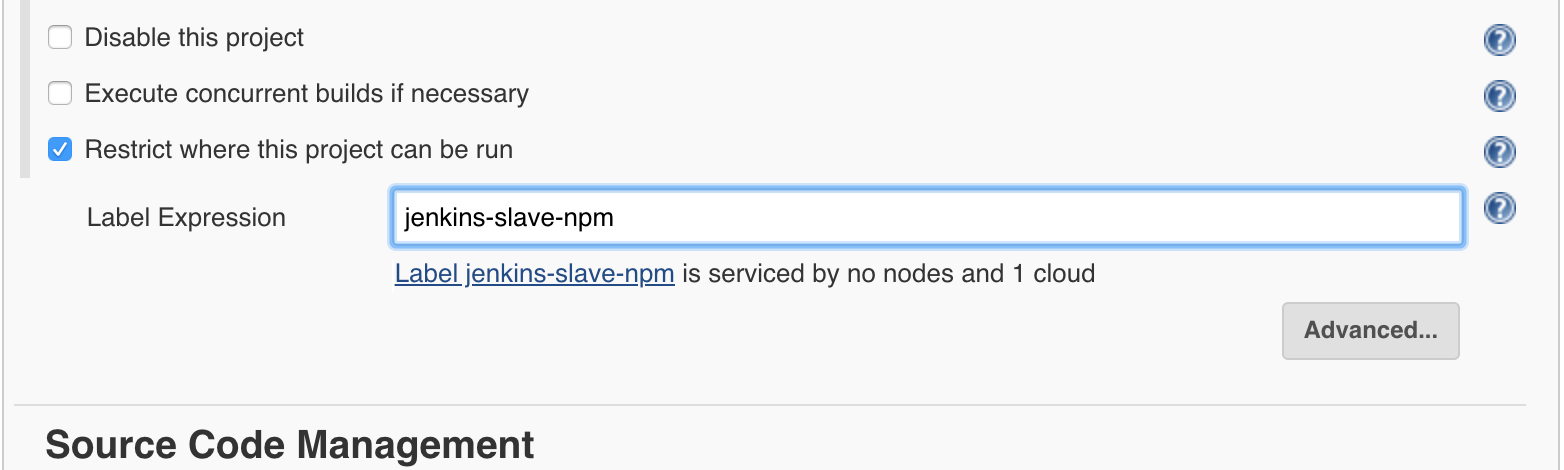
In the SCM section; set the project to use the todolist-api git project. Set the credentials accordingly.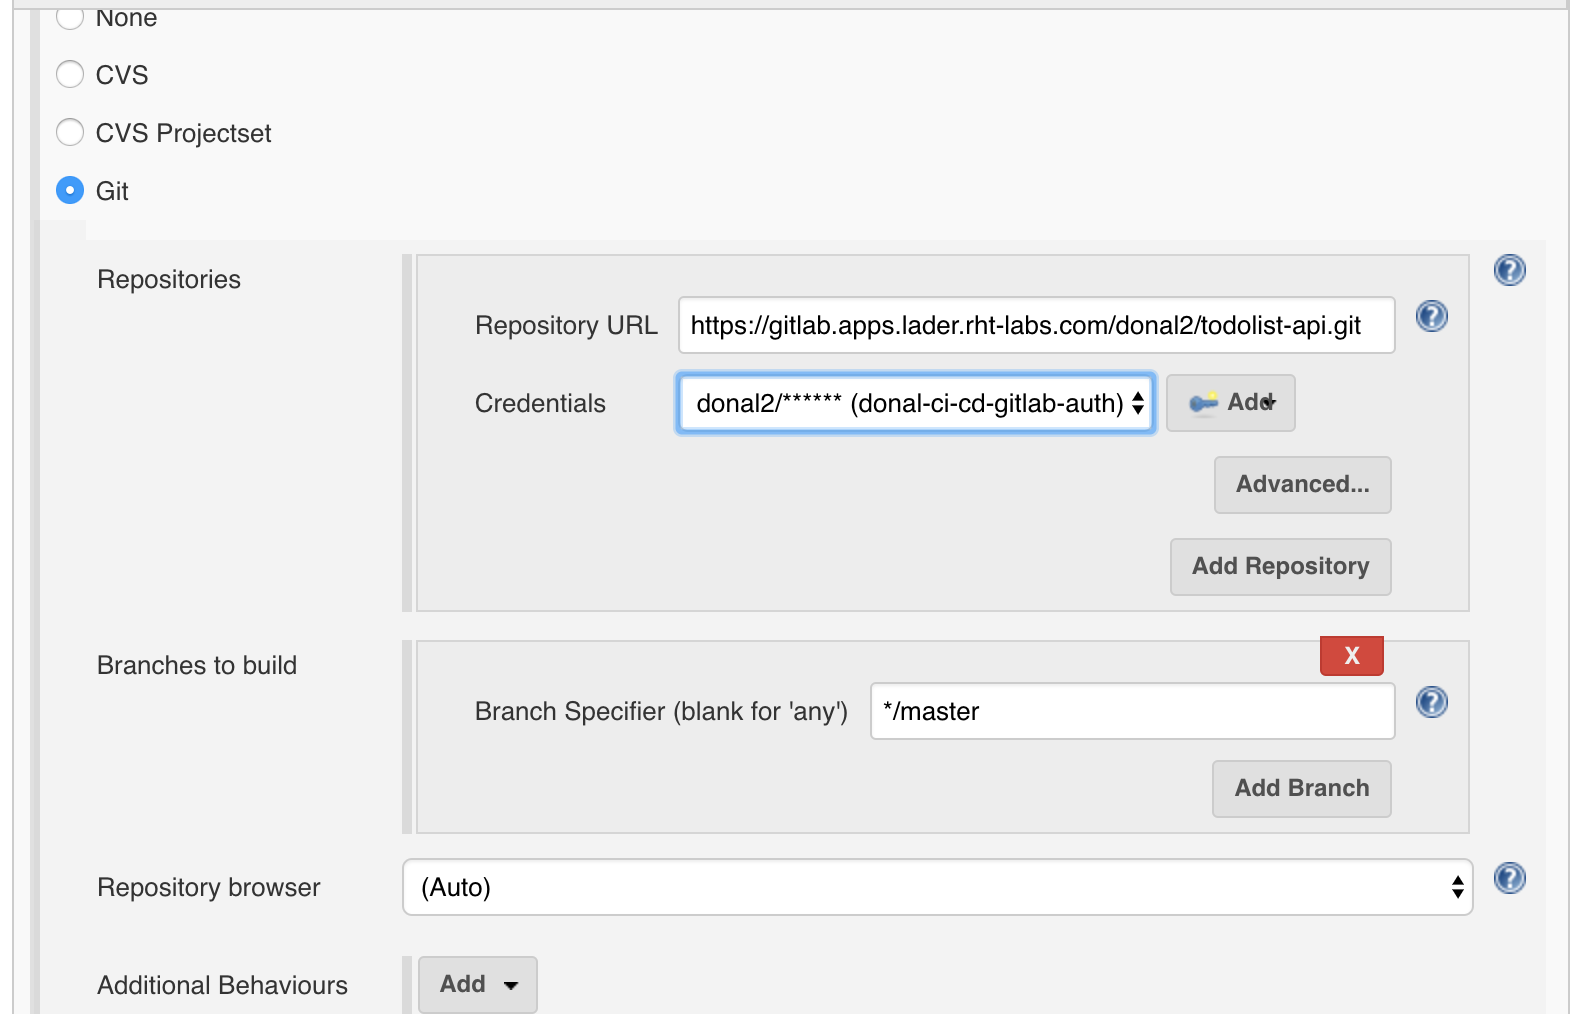
Set the build to execute each night; for example 0300 in the morning. Hit Build periodically on the Build Triggers section and set it to H 3 * * *.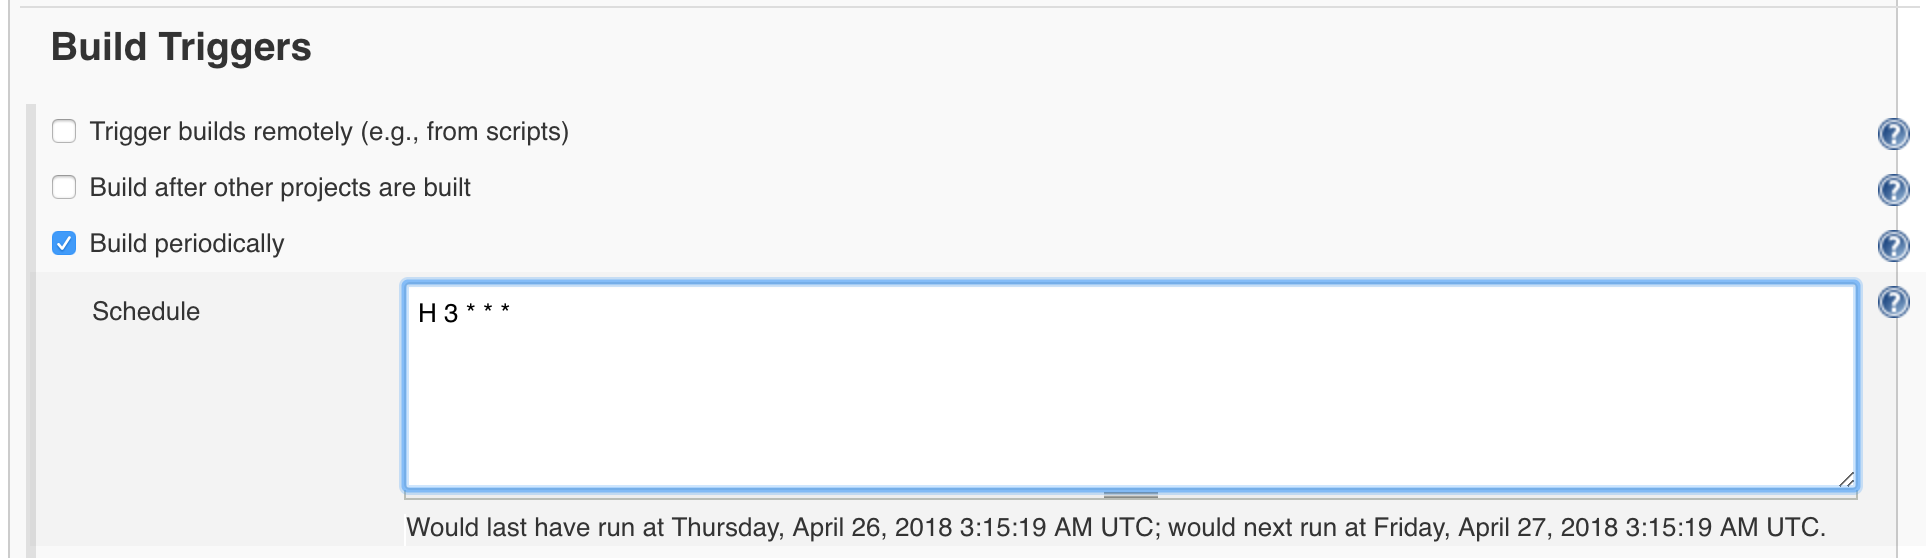
Set the Color ANSI Console Output on the Build Environment section.
Click add build step and select execute shell and add the following to it, replacing <YOUR_NAME> as expected. We will just test the create and show API for the moment. We are grabbing the response code of the perf-test to keep Jenkins running both shells steps and then exiting with whichever fails:bash export E2E_TEST_ROUTE=todolist-api-<YOUR_NAME>-dev.<APPS_URL> npm install set +e npm run perf-test:create rc1=$? npm run perf-test:show rc2=$? set -e exit $(($rc1 | $rc2))
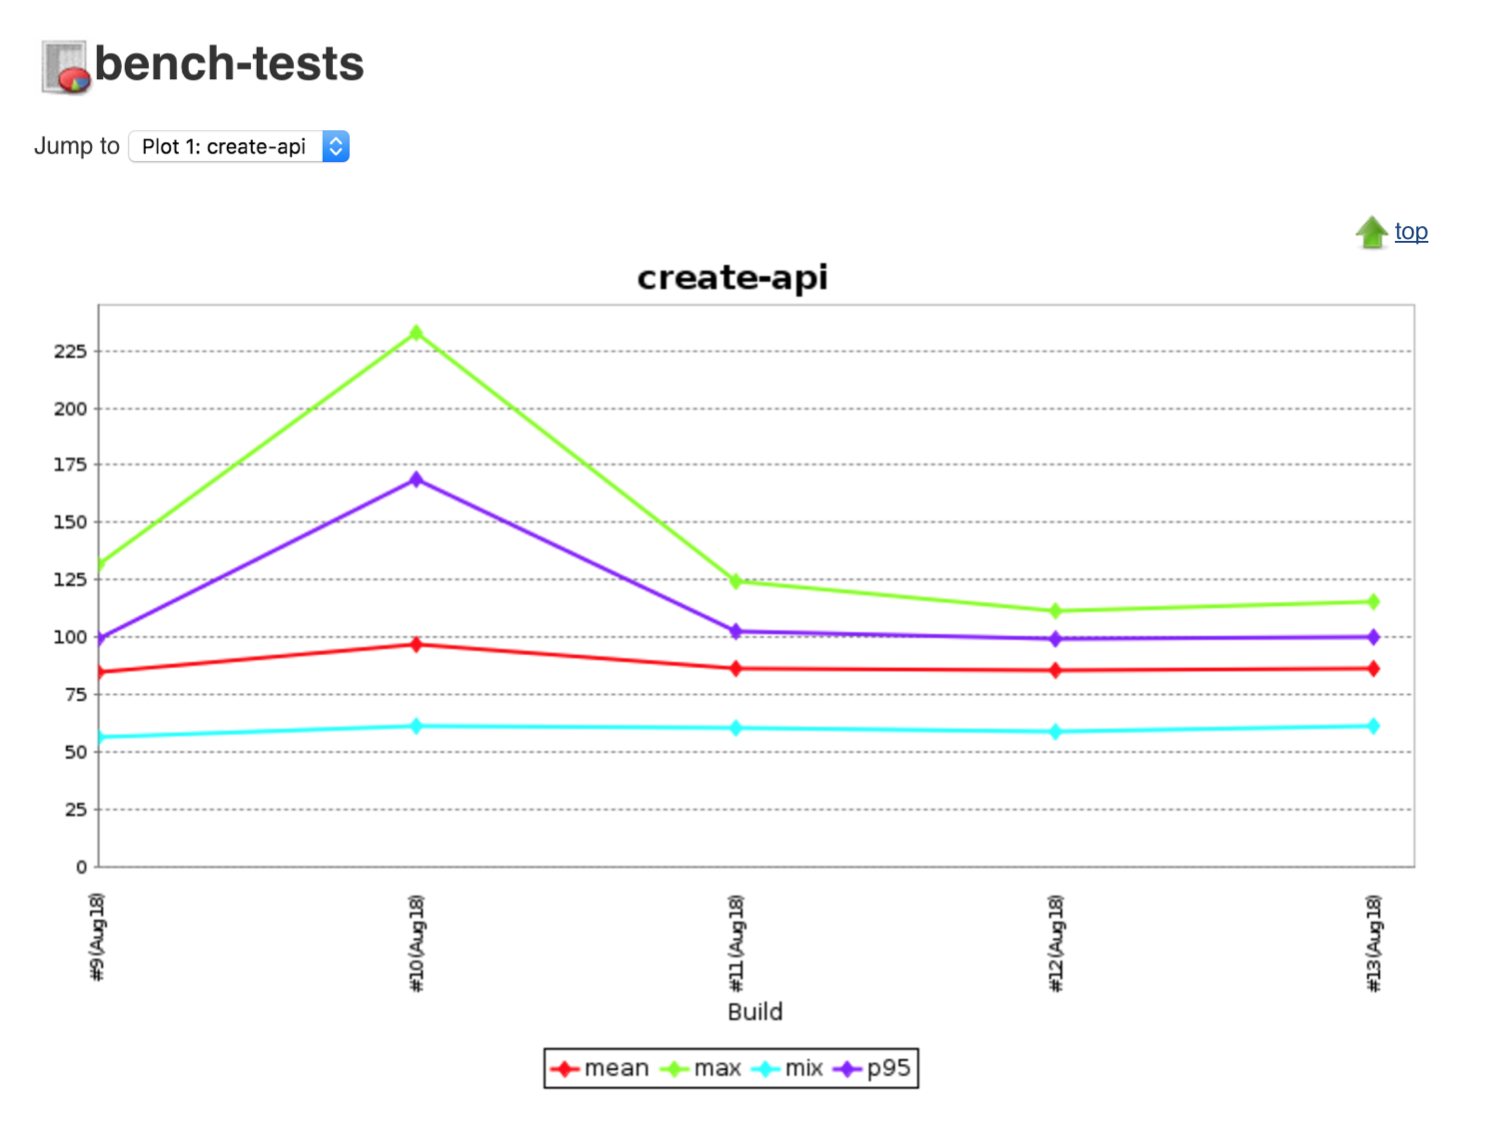
On the Post Build actions section we will plot the data from the perf tests in Jenkins. Add a Post-build Action > Plot Build Data.
On the new dialog, name the Plot group e.g. bench-tests and add create-api as the Plot title. Set the Number of Builds to Include to a large number like 100. Set the Data Series file to be reports/server/perf/create-perf-score.csv and mark the Load data from CSV field checkbox. Apply those changes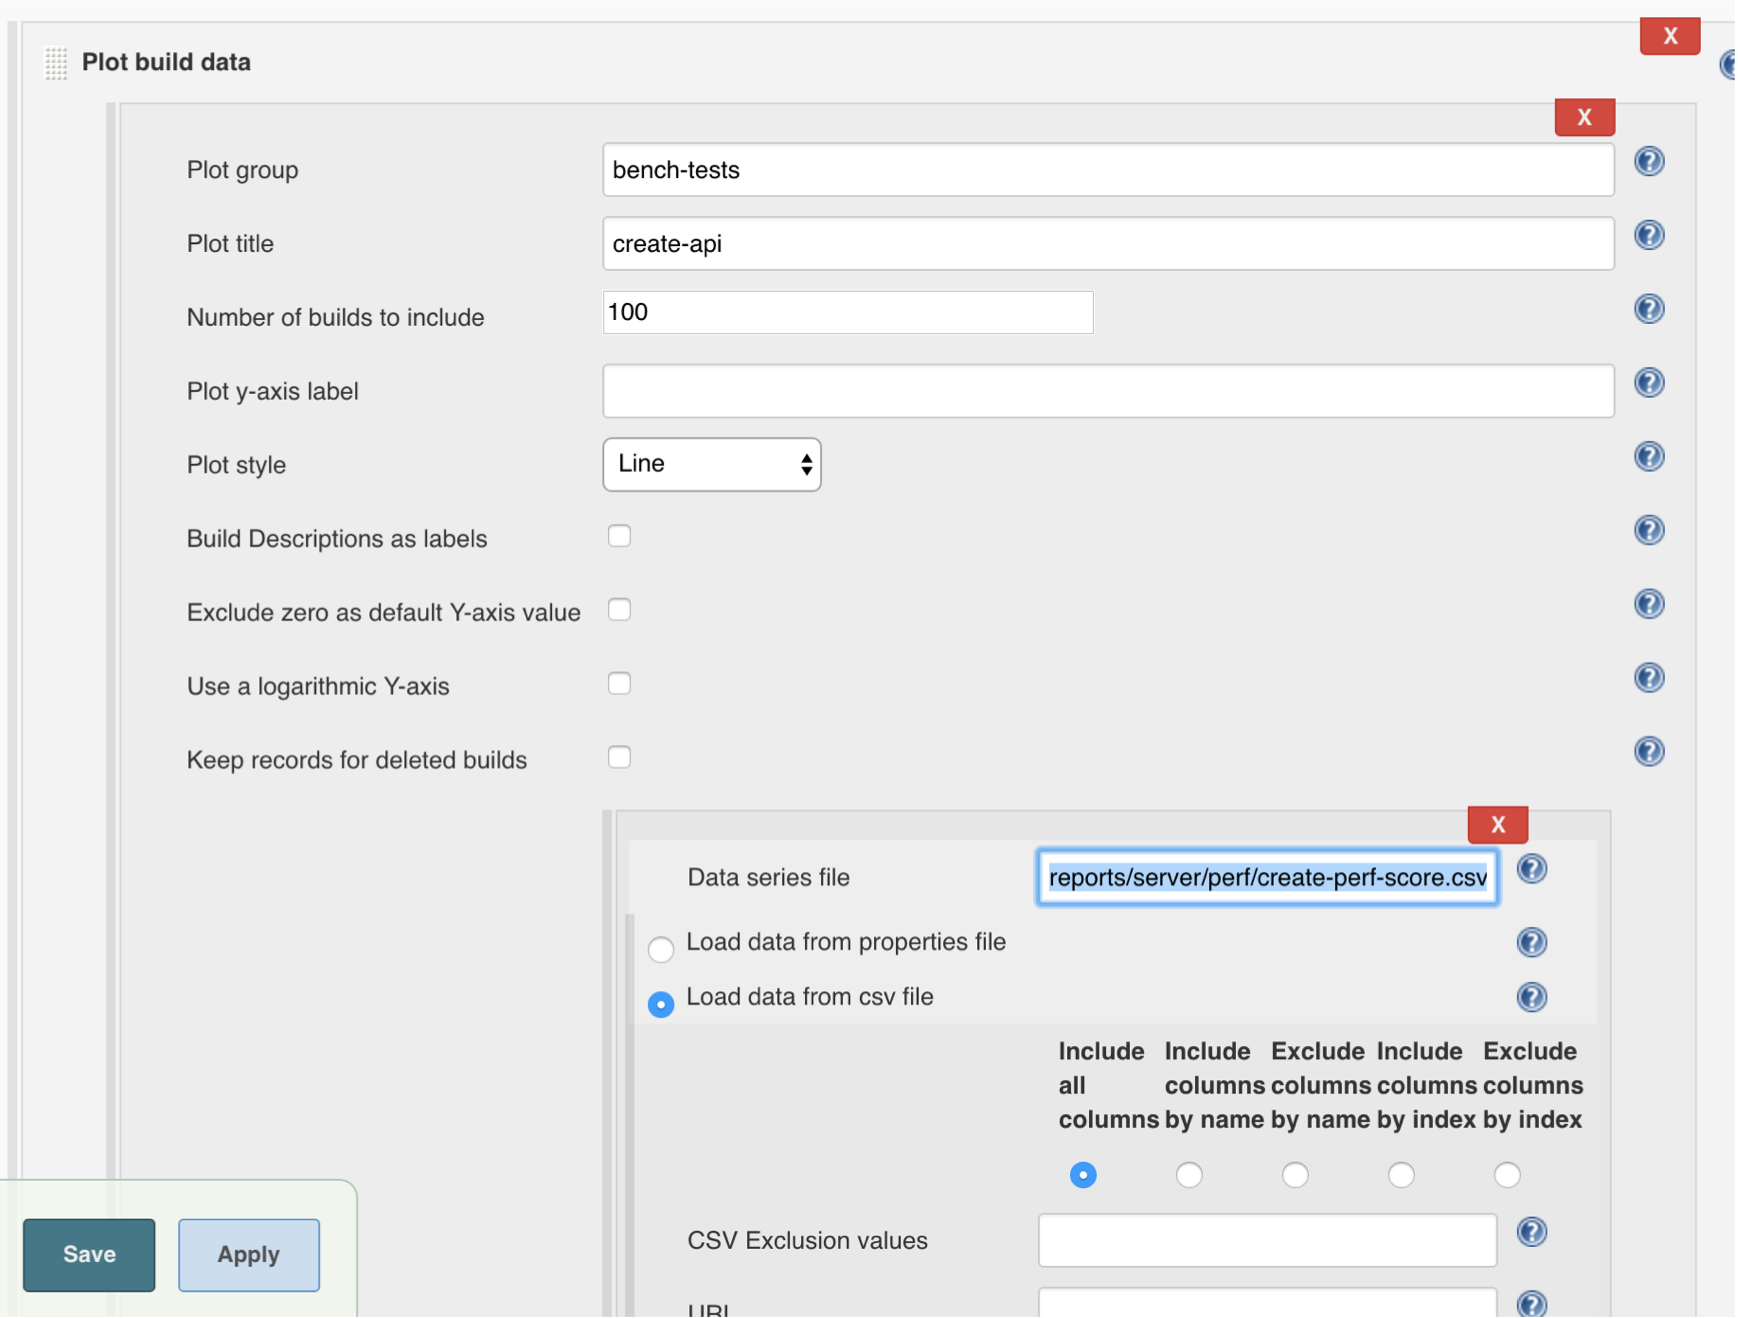
Hit Add Plot to add another. Set Plot group to bench-tests again but this time setting the Plot title to show-api. Set the Data Series file to be reports/server/perf/show-perf-score.csv and mark the Load data from CSV radio button. Save those changes and run the job (Job could take a while to execute!).
Run it a few times to start to generate the data points on the plot. The bench-tests plot is available on the job's homepage