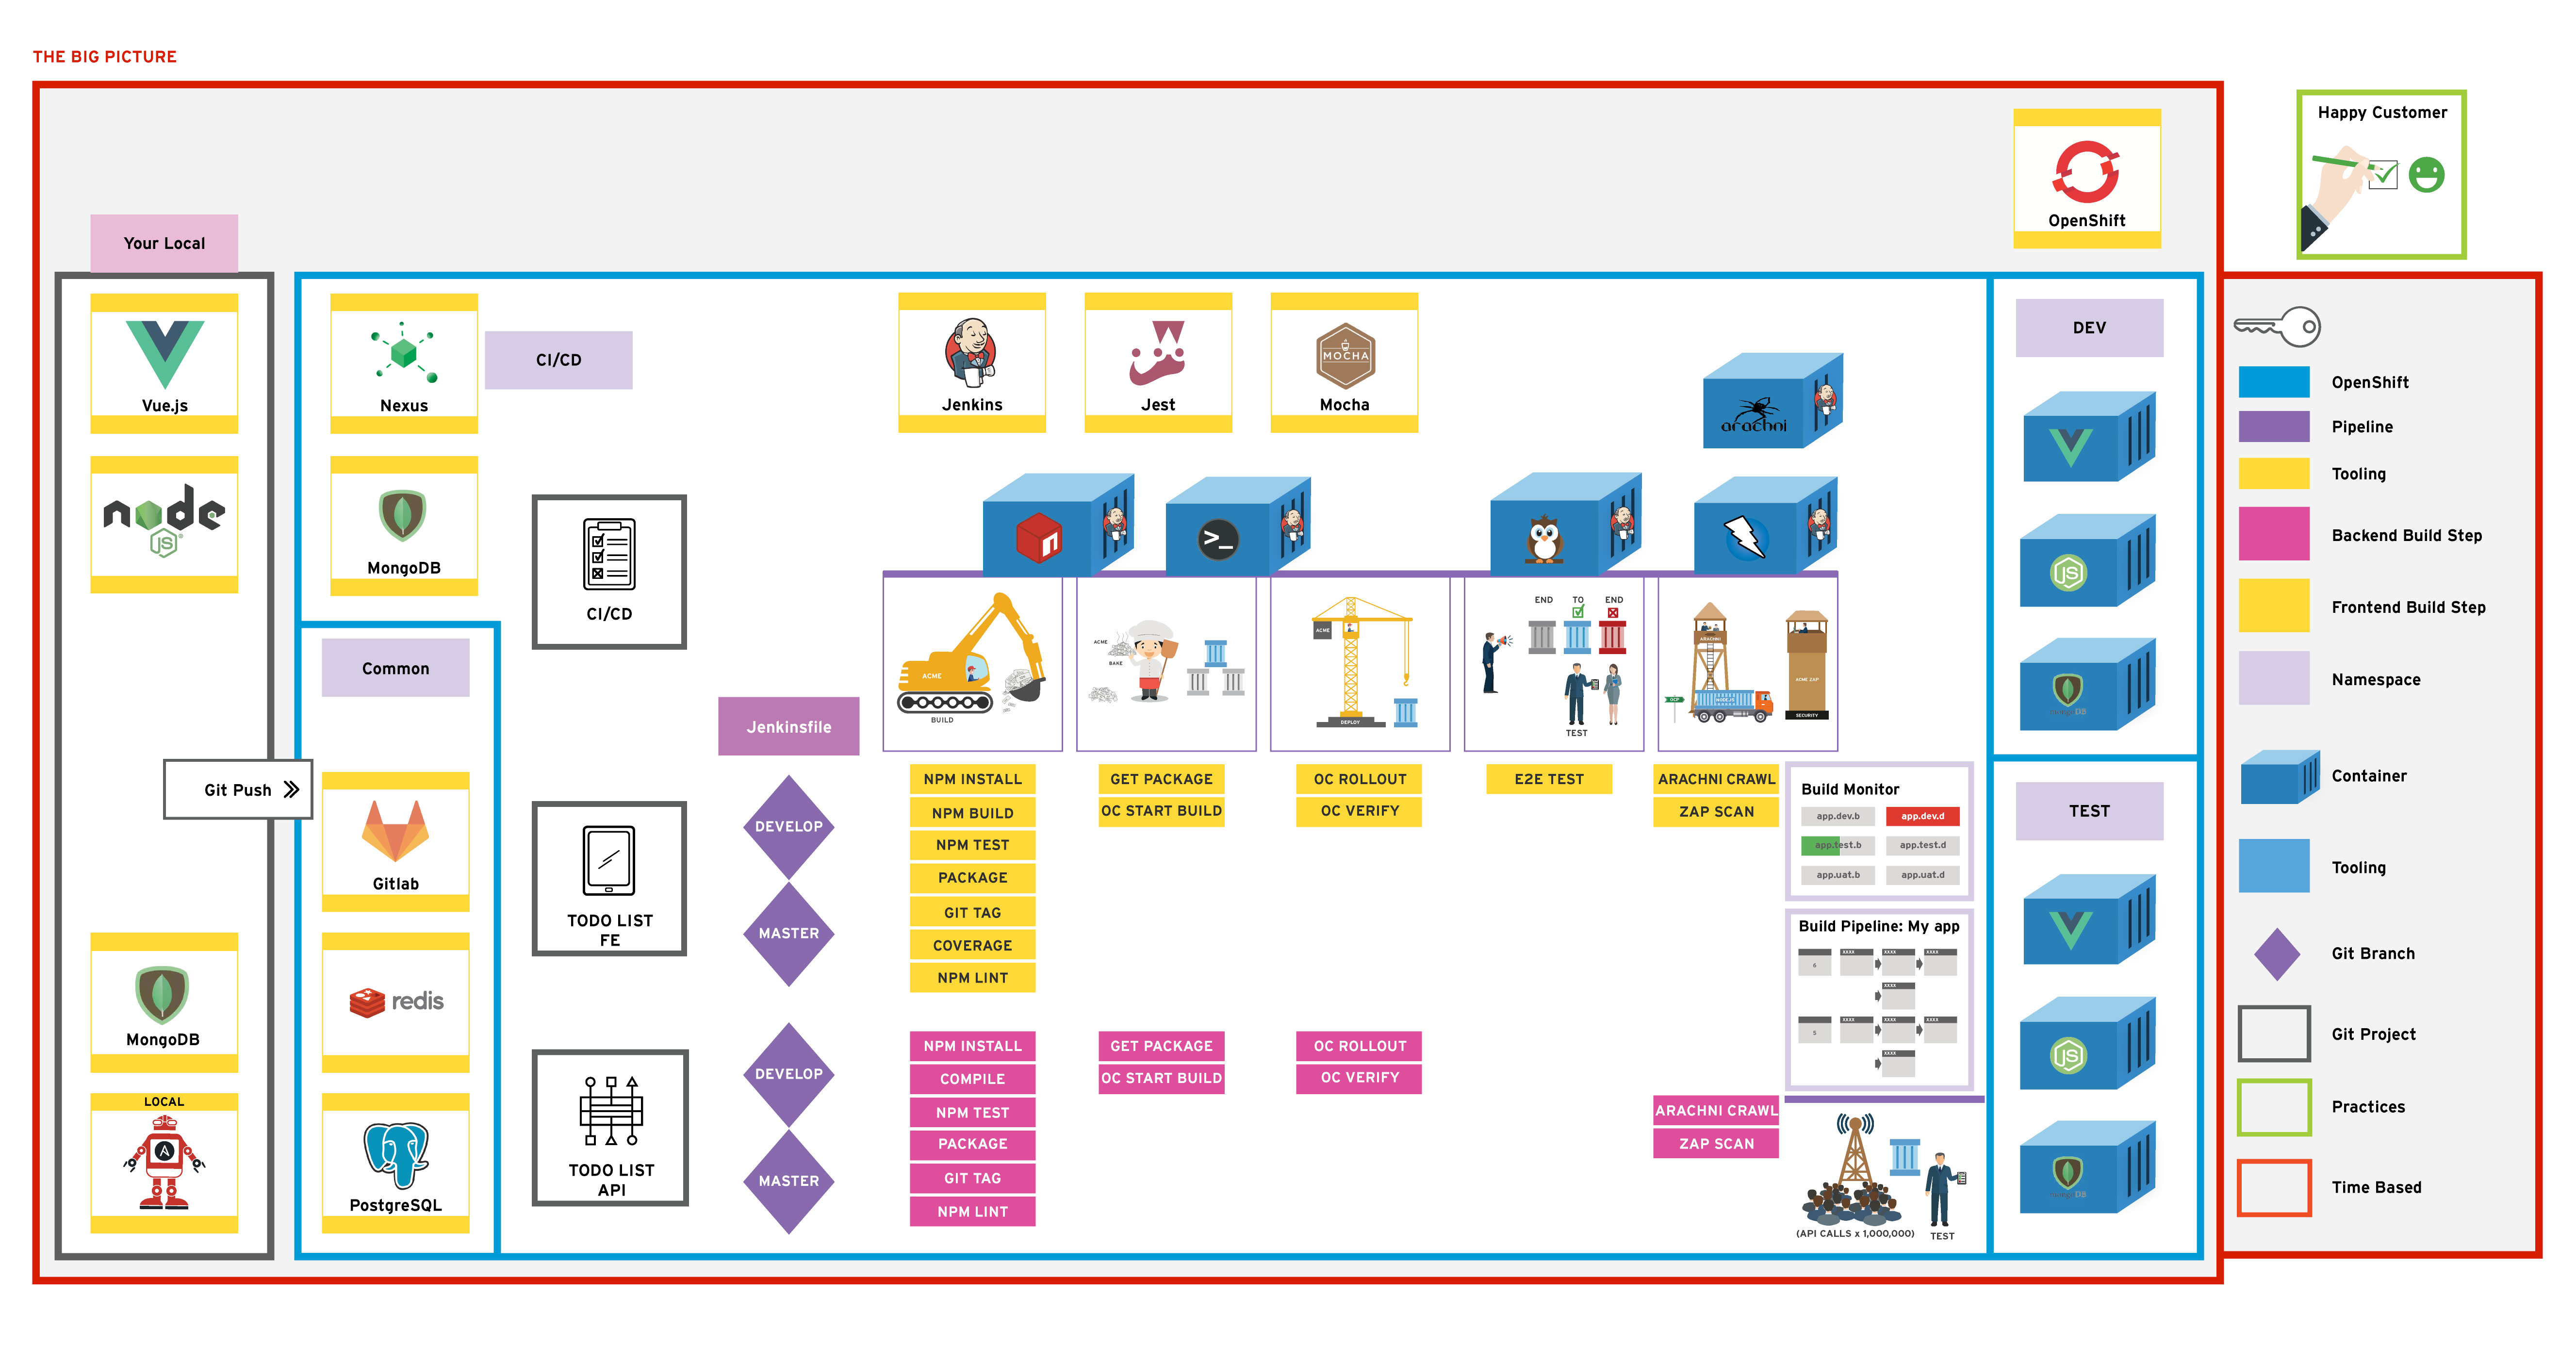
In this exercise we will create a build monitor to radiate vital build information and statistics
Build monitors provide a tight feedback loop which is vital to high performing teams. Being in a highly visible location, build monitors radiate crucial build and test information, meaning the team doesn't have to go out of their way to find it. Build monitors also provide a degree of accountability whilst also keeping the team motivated to fix problems. With broken components visualised, seeing build monitors change from red to green can give the collective feeling that progress is being made.
On residencies we display the build monitors on Raspberry Pi's hooked up to large TV screens that everyone can see at a glance. We've also used colour-changing lightbulbs in the labs that change from Green to Red depending on the success/fail status of jobs. There are many other ways to notify people of Build Failures such as Slack notices, text messages or just plain old email. This exercise is about radiating the information to allow teams respond quickly to change.
In this Exercise we will be creating a build monitor to display all of our jobs in one visual display as well as pipeline views. We will then add the cause of build failures for each job to the monitors. This will allow you to rapidly see why a particular build is failing and fix it faster.
Finally, build monitors can promote team cohesion as they enable all team members to be on the same page regarding the current project status. They can also engage business users and clients on the stats of the system. The most important thing here isn't the tool, but the visual feedback.
____
As a learner you will be able to
- Create dashboards in Jenkins to display build status
- Seed Jenkins using DSL to create dashboards by default
Name of tool - short description and link to docs or website
From the previous exercise; we introduced non-functional testing to our pipeline. This exercise focuses on radiation of useful information such as build stats and times from our pipeline.
The goal of this exercise is to introduce Build Monitors to radiate team's progress on Dashboards.
Create a new Dashboard for our Builds using the plugin above. Use Regex to add jobs to it. Use the BuildFail Analyser to add meaningful data to the reason for failures.
Use the pipeline views in OpenShift and Jenkins to produce dashboards that teams can use.
In this exercise we will create a new build monitor to show key information about our builds
On Jenkins home page; create a new view by hitting the plus icon on the home screen (should be beside the all above the jobs list)
Give the job a sensible name such as todolist-monitor and select Build Monitor View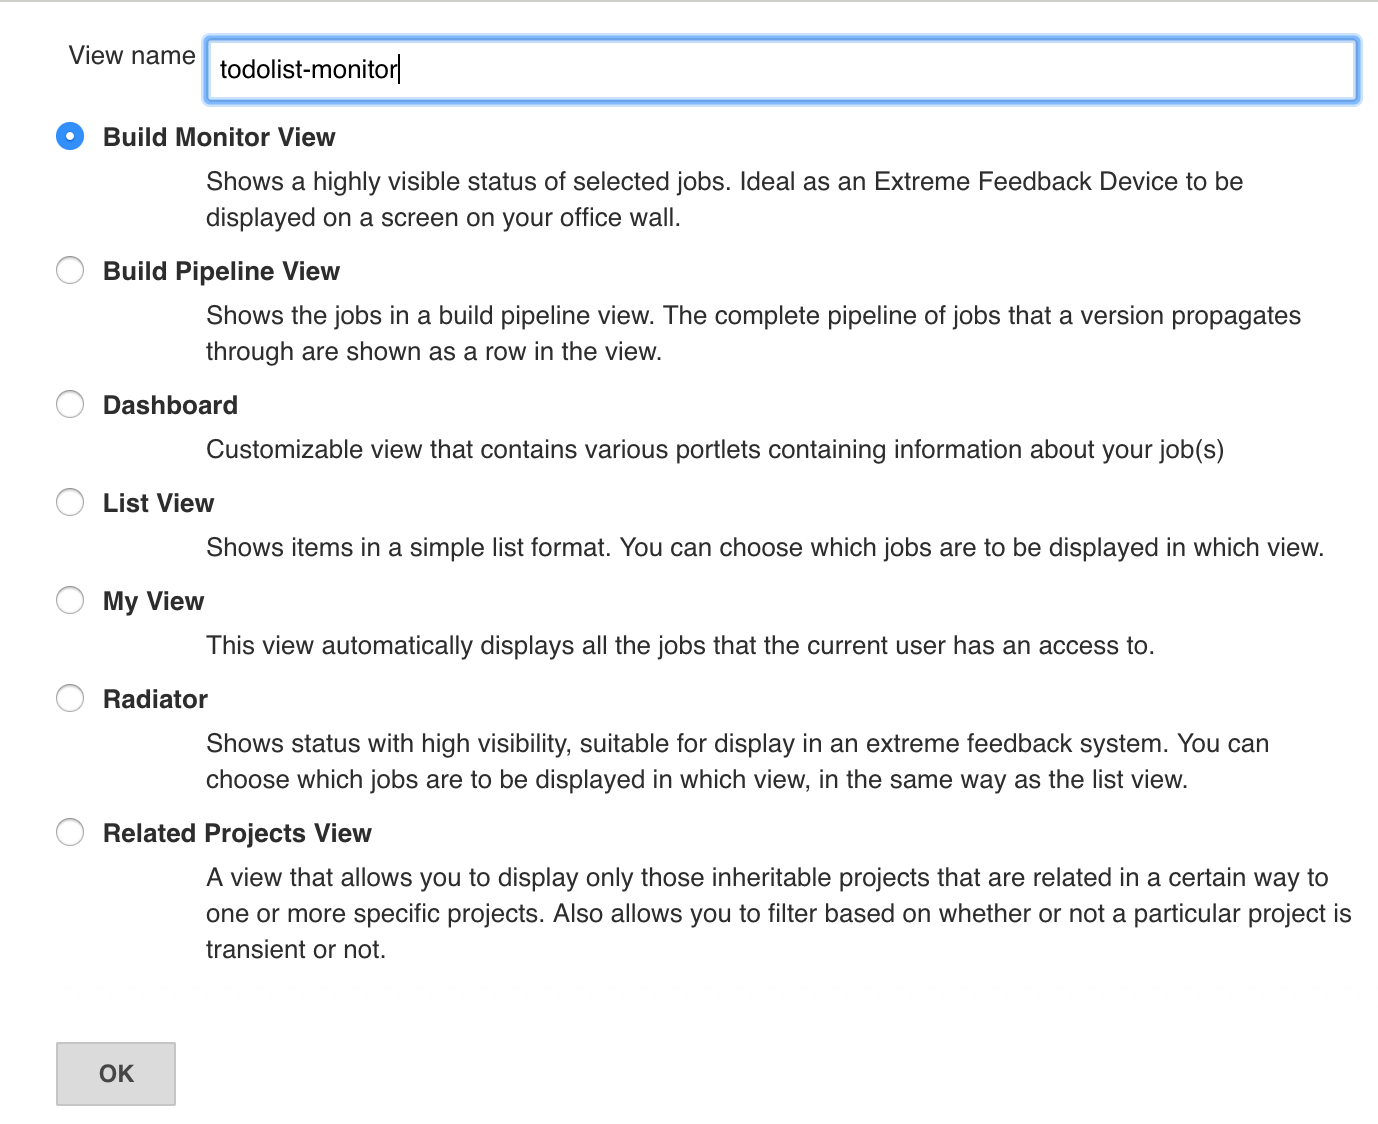
On the configuration page; select Recurse in subfolders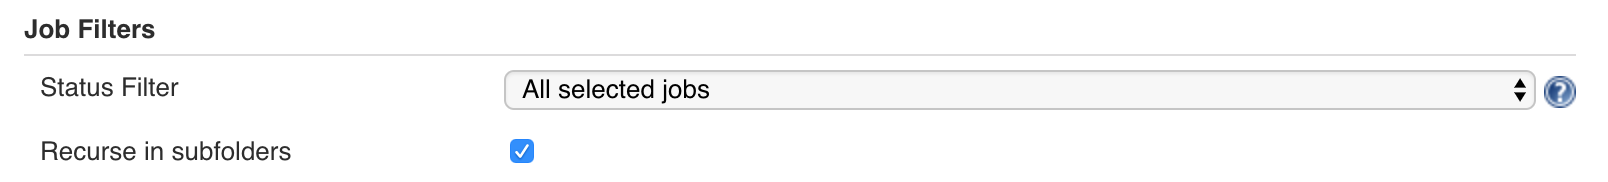
Check the box to use Regular Expression and set the value to be something that should scrape our apps such as .*todolist.*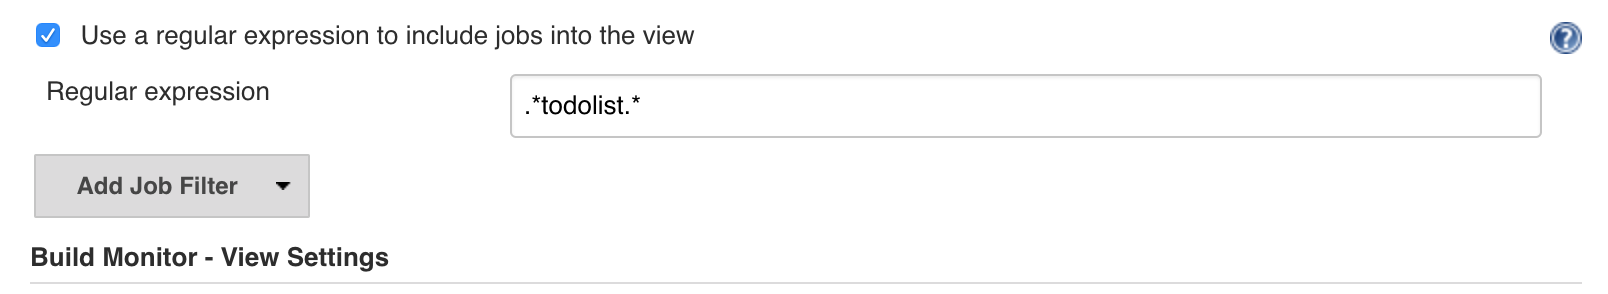
Finally; select Display committers and set the Failure Analyser to Description. This allows us to write regexes for when failures occur in Jenkins and have the reasons plotted on the graph. For example; number of test scores or common compilation errors.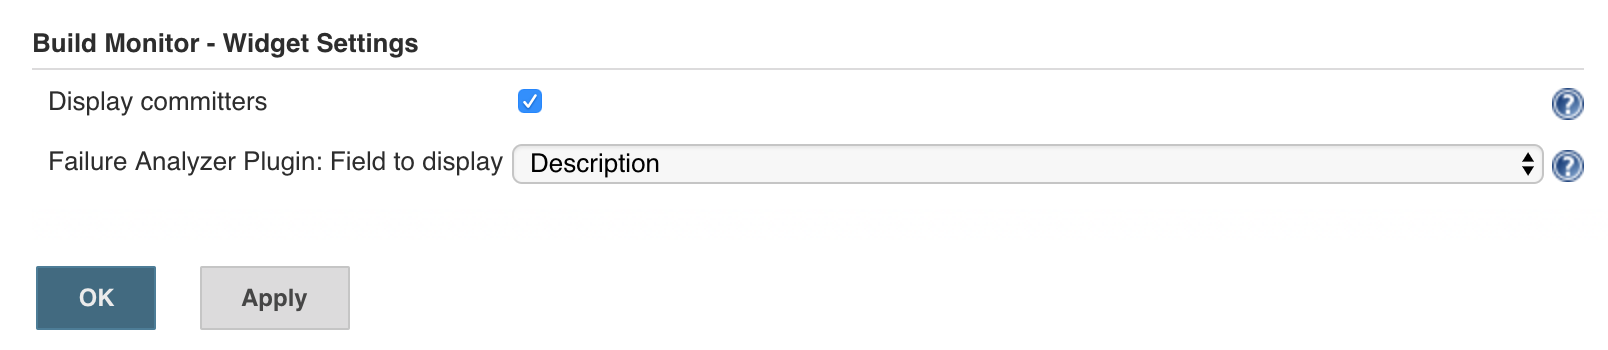
Save your configuration to see your Build Monitor!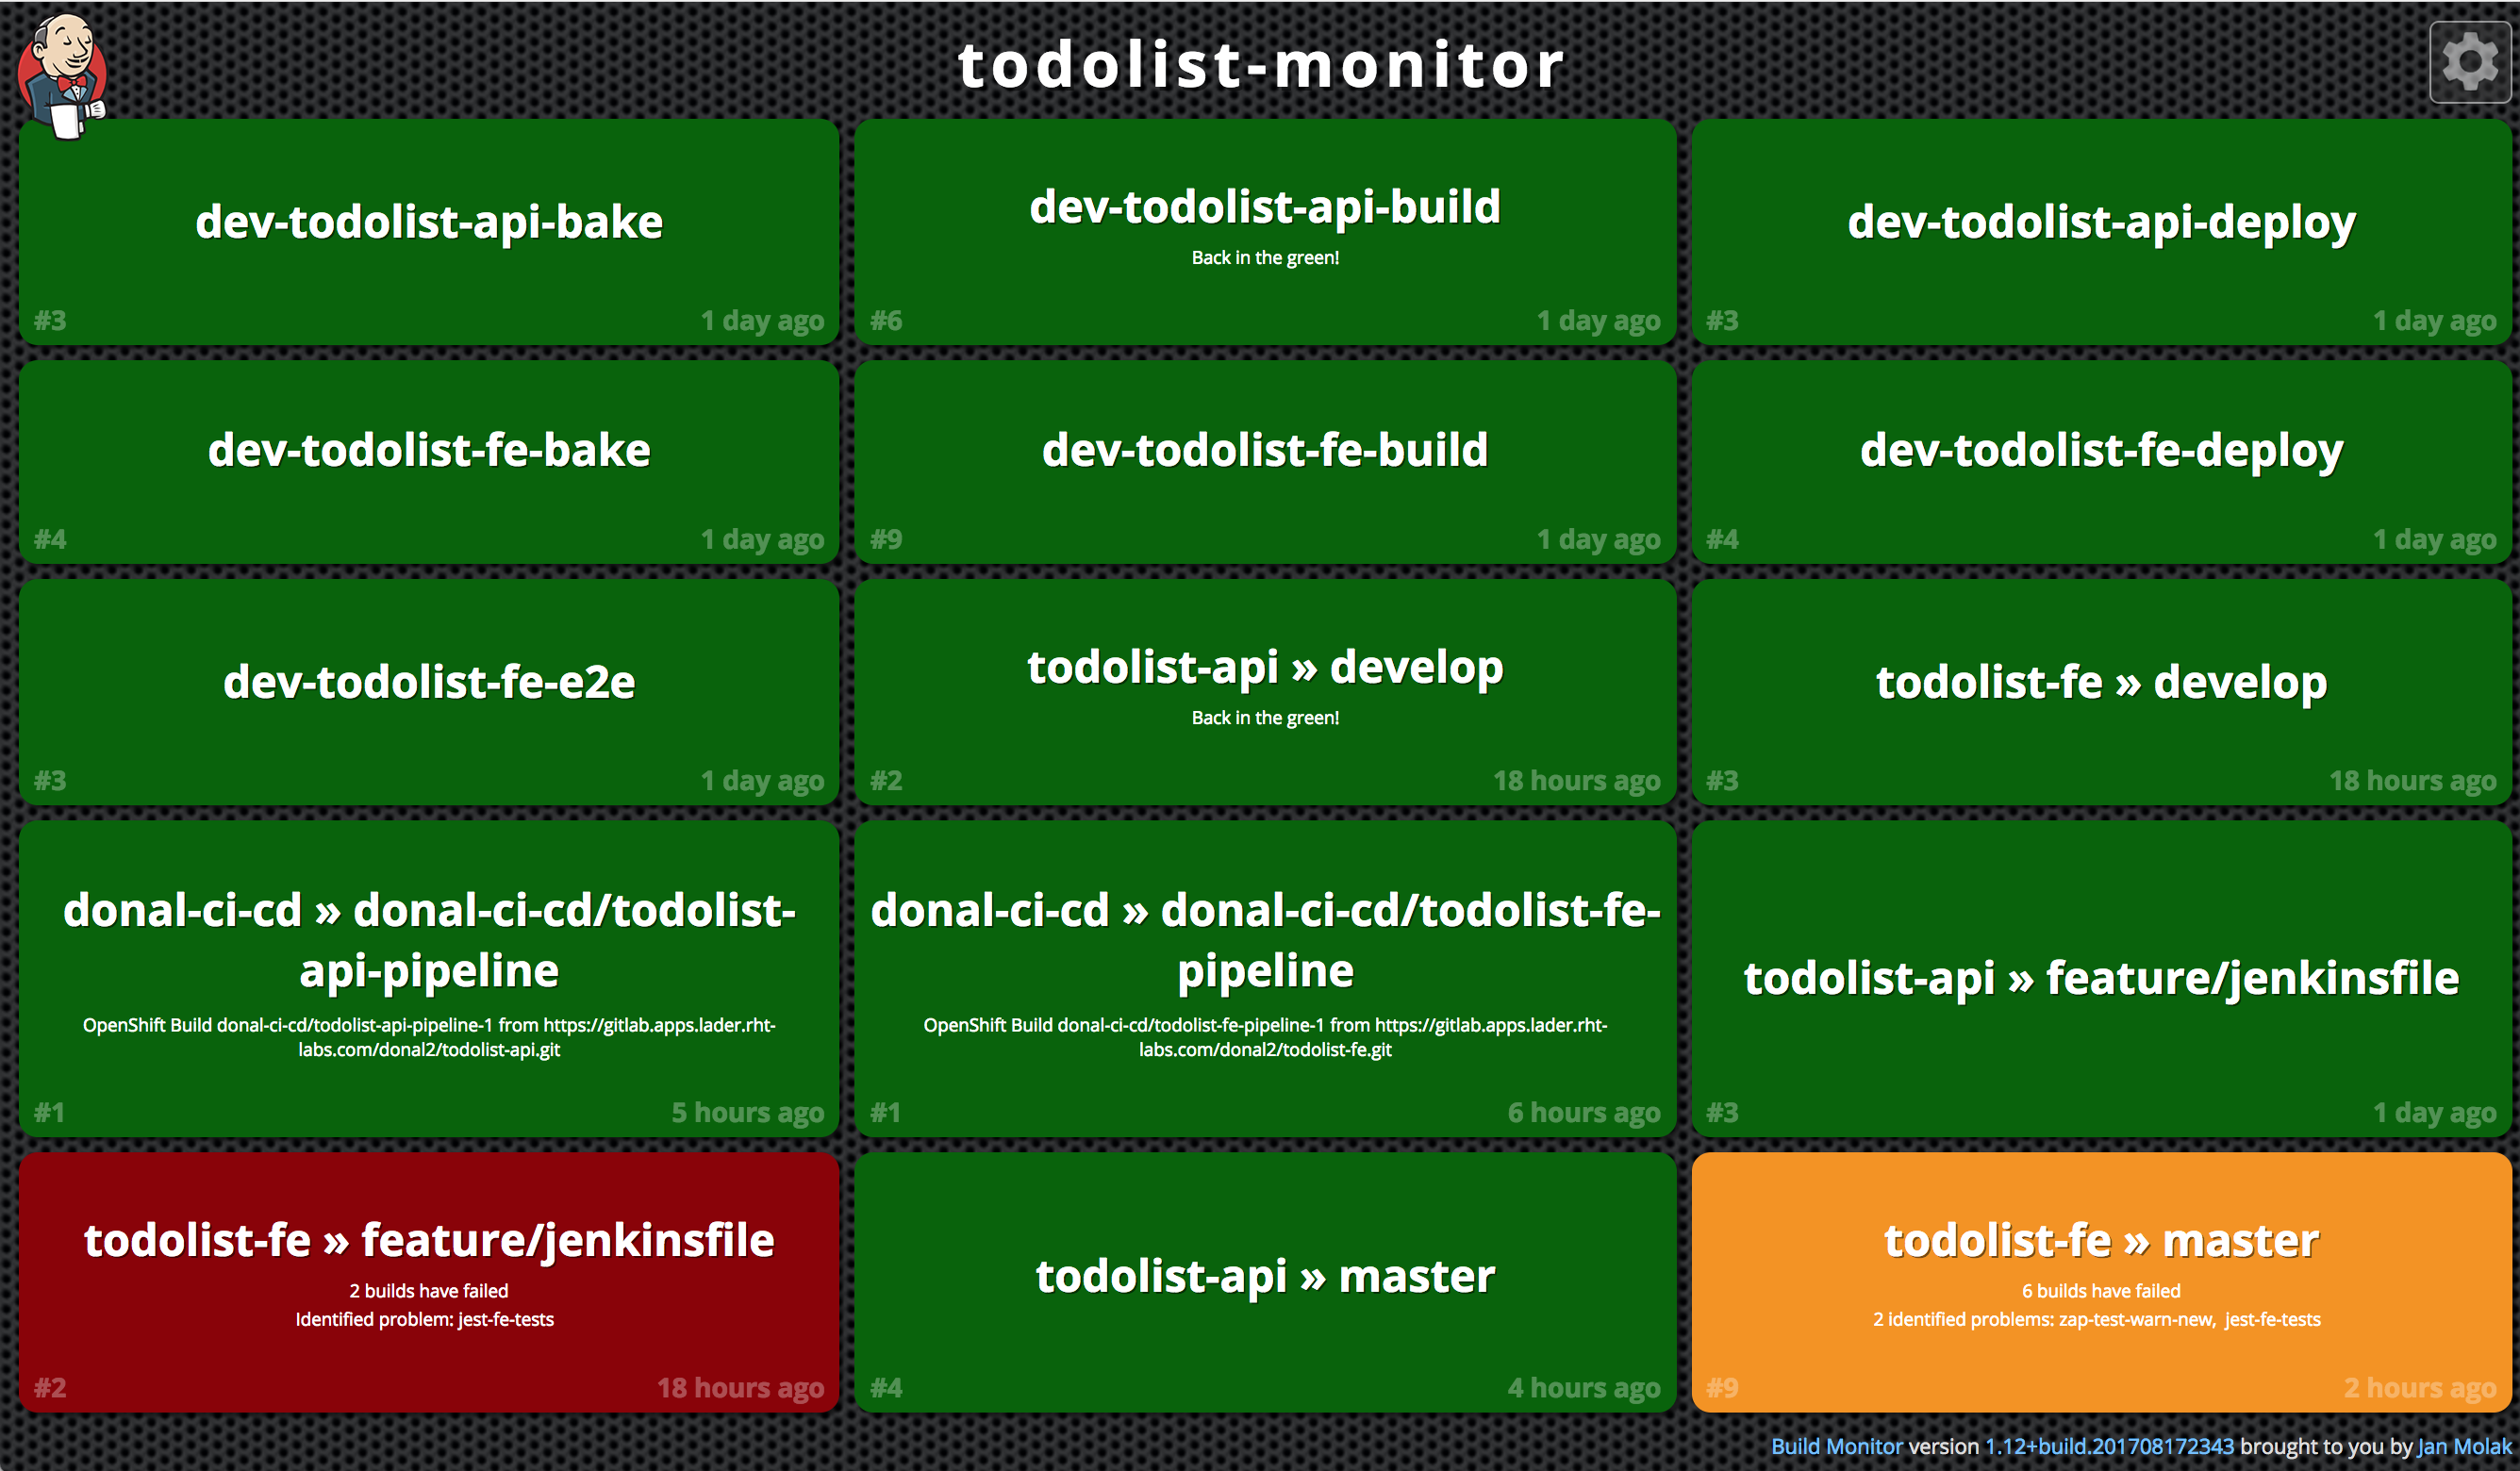
NOTE: You can exit the build monitor view by clicking on the Jenkins icon in the top left corner.
Let's create another view for Jenkins using the Pipeline Aggregator View plugin. This view is great because it shows lots of valuable information in a clean; easy to visualise way. Create a new view called todolist-pipelines and select Pipeline Aggregator View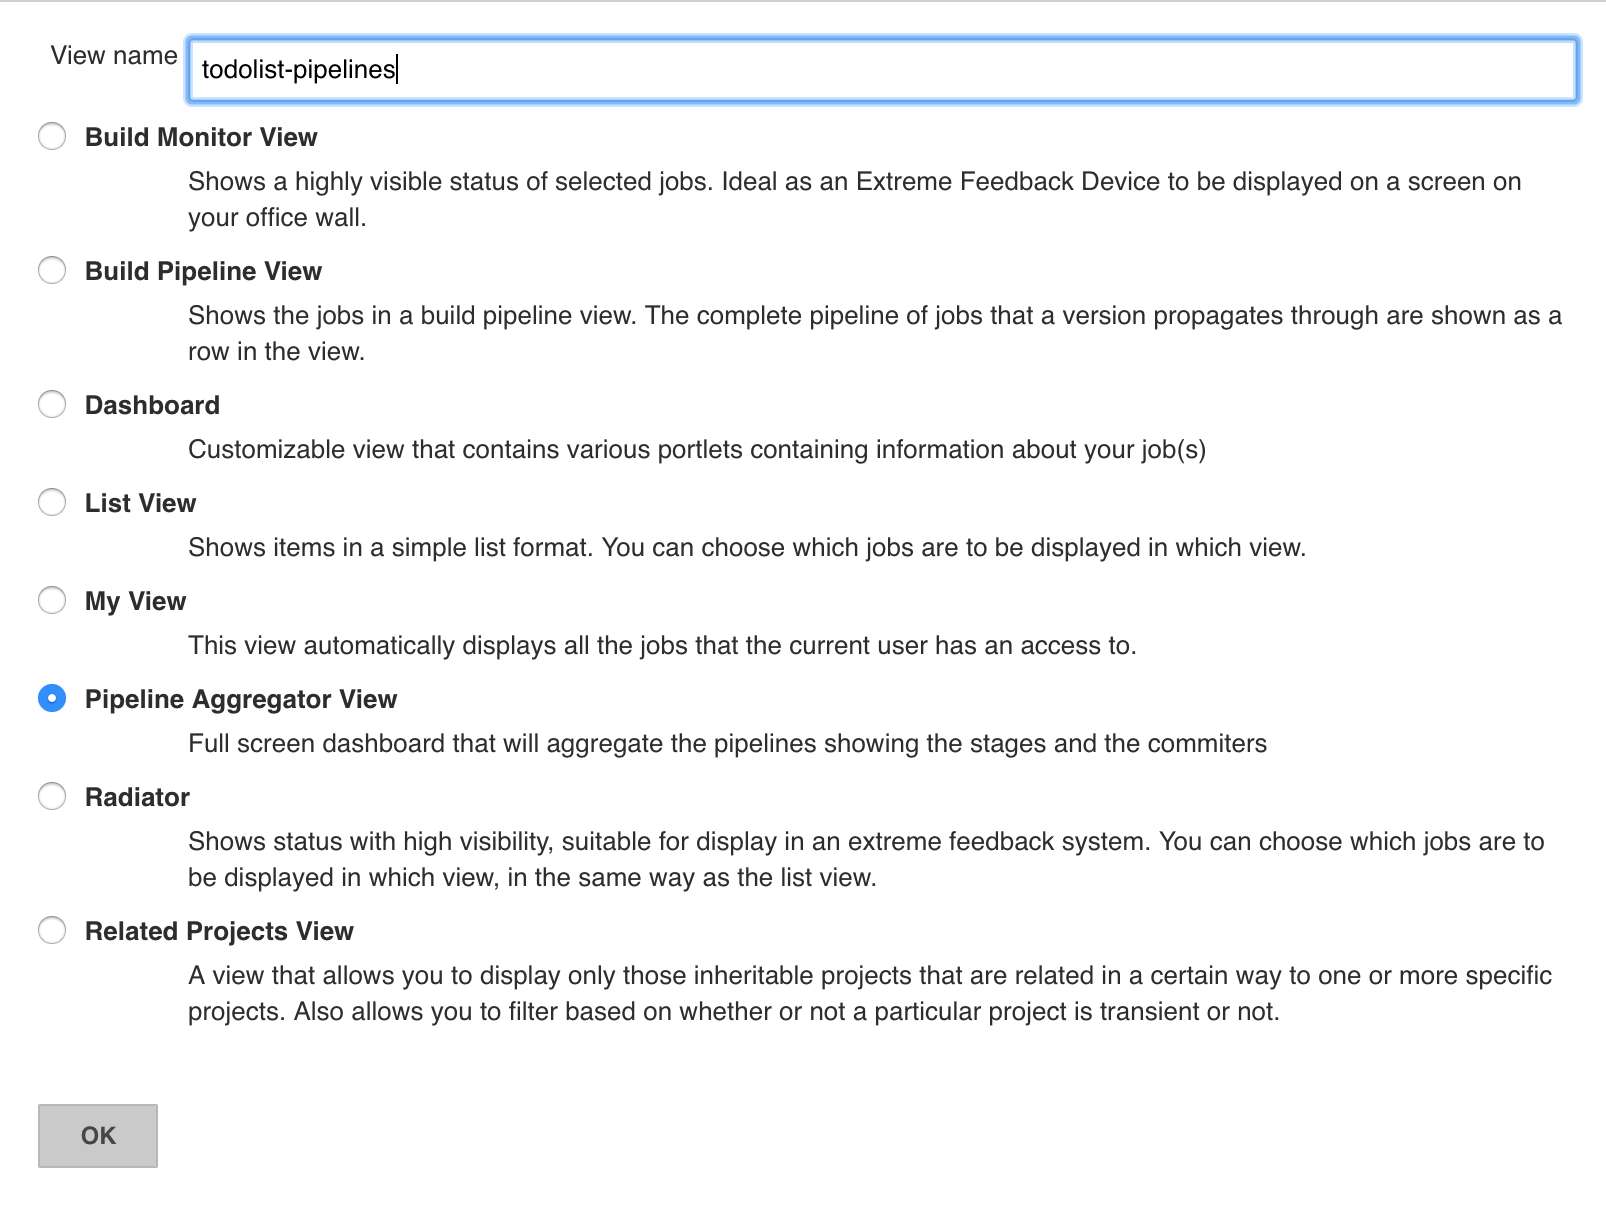
On the configure page; set the regex to todolist.*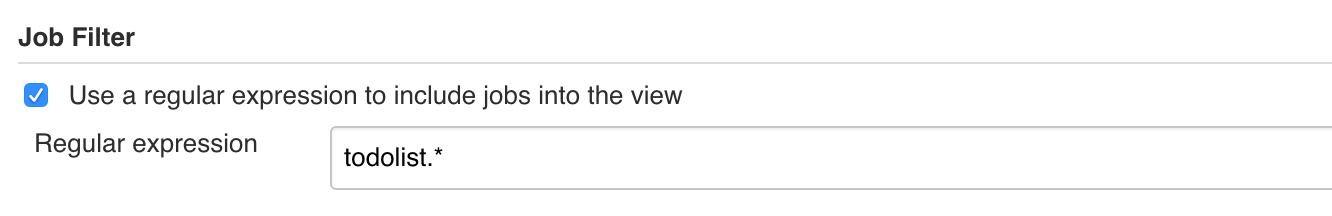
Set the view to Only display last build for simplicity of the view, and select the Use condensed tables option.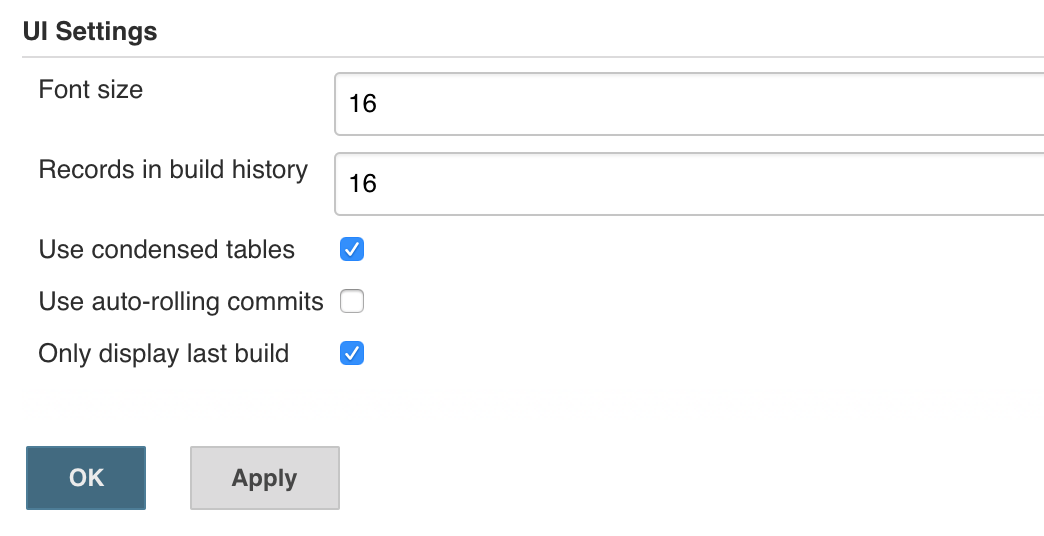
Save your configuration to see your Build Monitor!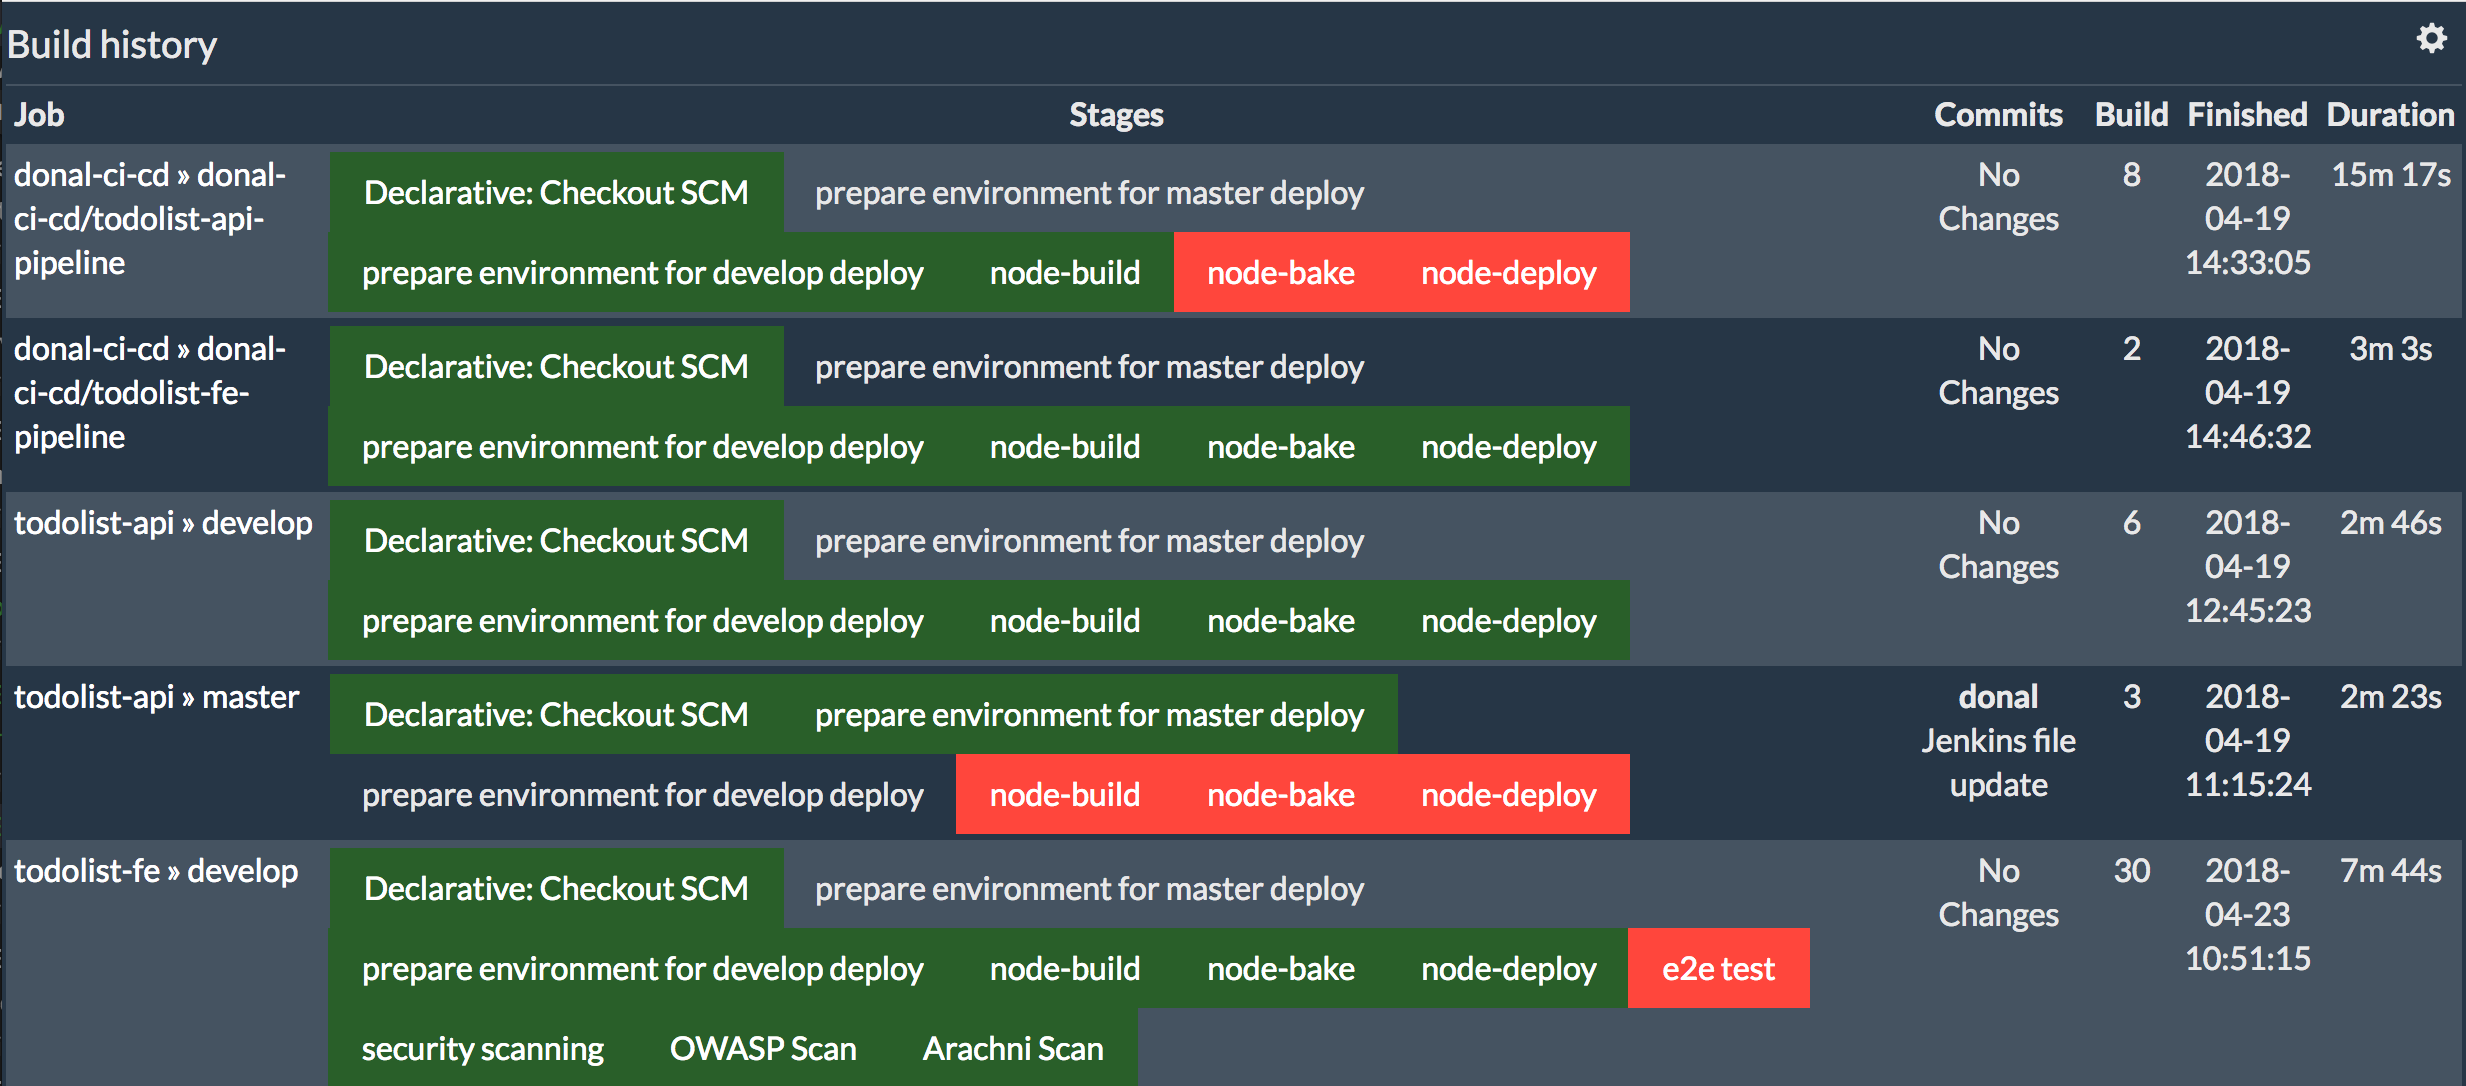
Explore the Jenkins Blue Ocean view for some additional monitors and views that make Jenkins look pretty!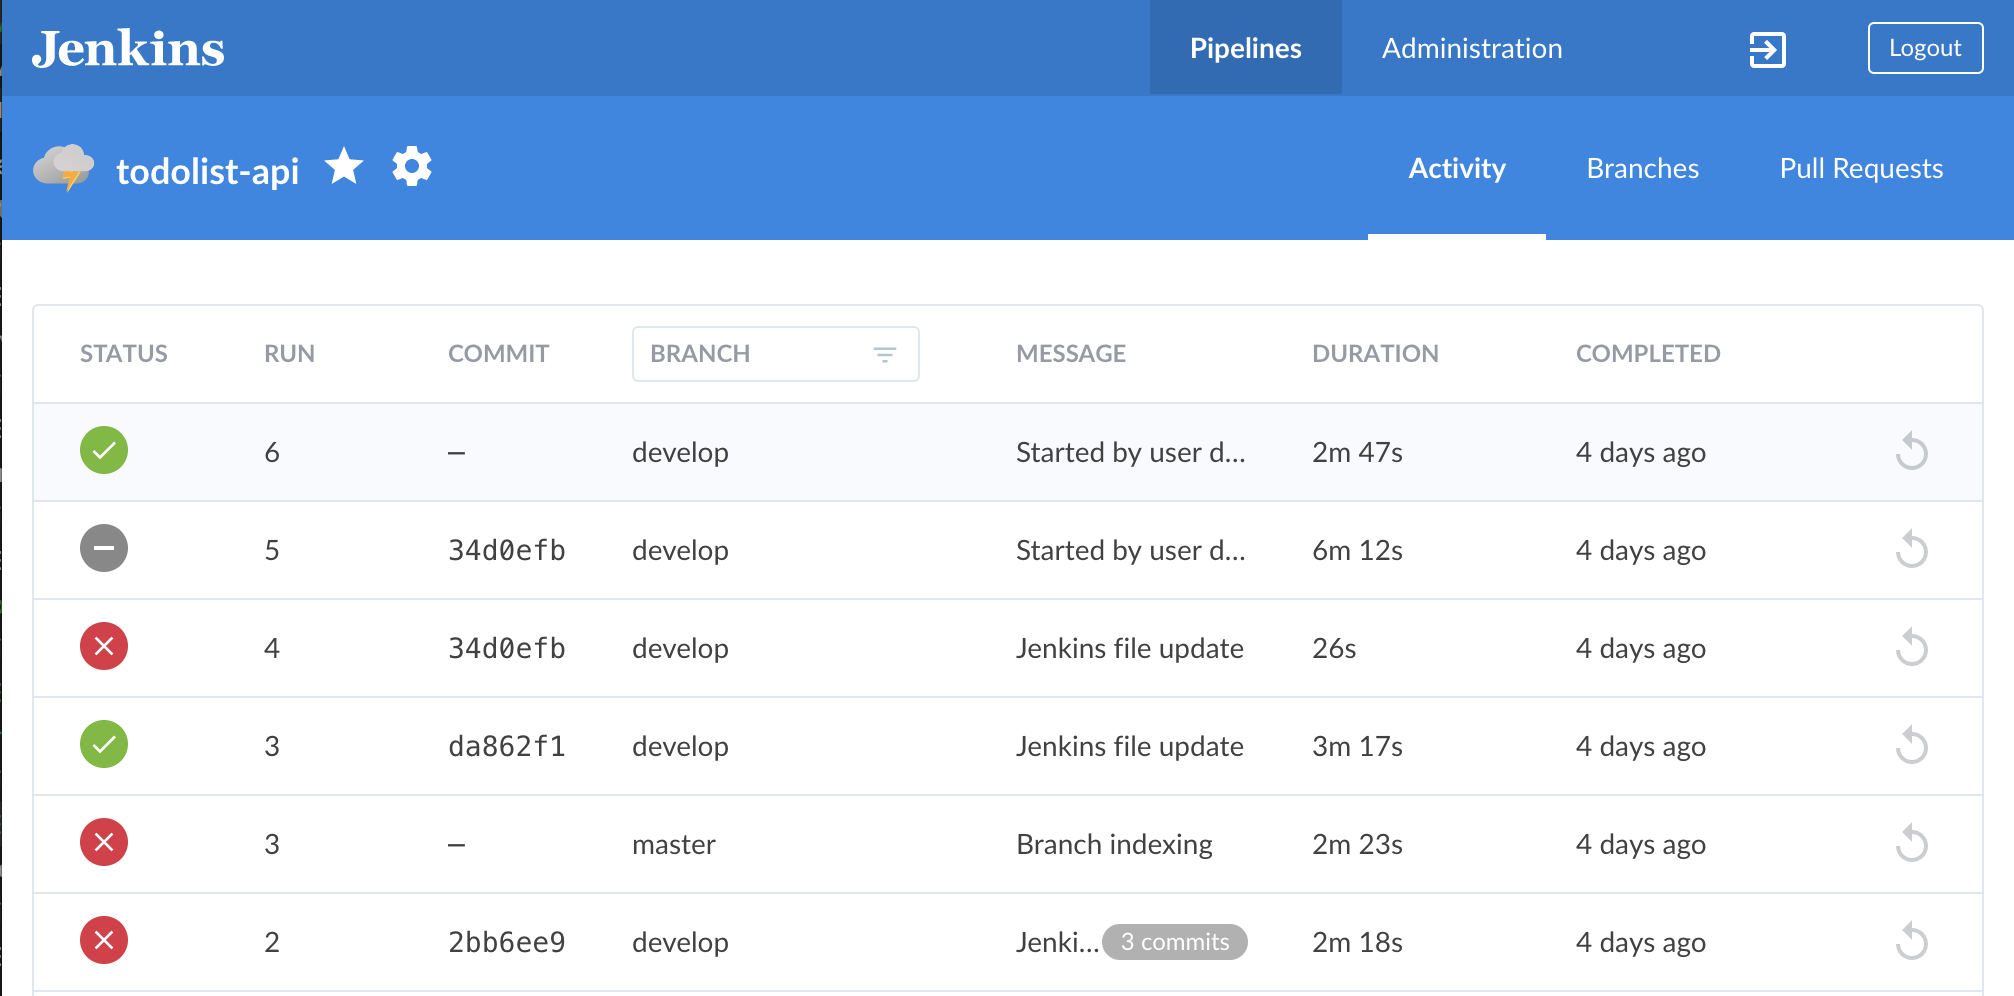
In this exercise we will intentionally fail the build to capture some metrics about why it's failed and how we can tighten the feedback for future failures
Open the todolist-fe app in your favourite editor. In this exercise, we will fail a test and capture the message in the log and visualise it on a dashboard.
Open one of the tests you wrote in previous exercises; for example tests/unit/vue-components/TodoItem.spec.js. Negate the test at the very bottom of the file by adding a .not to the expect() statement as shown below.javascript it("call makImportant when clicked", () => { const wrapper = mount(TodoItem, { methods, propsData: { todoItem: importantTodo } }); // TODO - test goes here! const input = wrapper.find(".important-flag"); input.trigger("click"); expect(methods.markImportant).not.toHaveBeenCalled(); }); });
Run your tests locally and you should see one failing test as shown below. Jenkins will have the same output so we can capture this as code!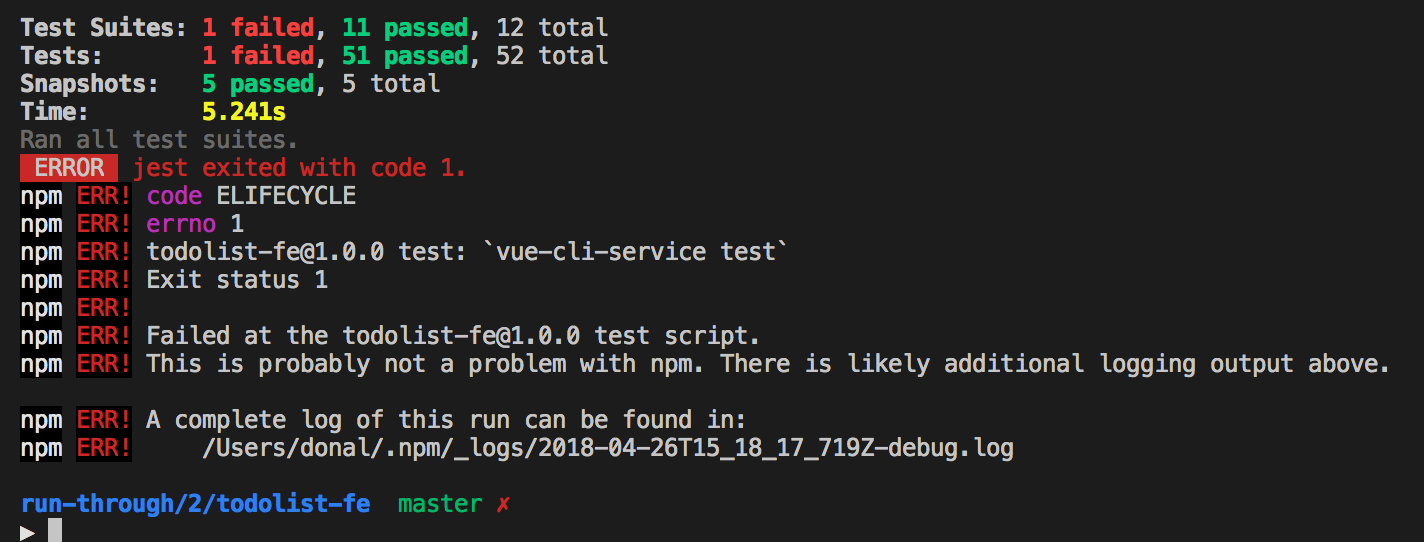
The Test Suites: 1 failed, 11 passed, 12 total string can be coded into a regex. On Jenkins homepage; hit the Failure Cause Management nav on the left hand menu. On the page that loads; hit Create new.
Call the new Failure Cause jest-tests. Set the Description to be ${1,1} failed out of ${1,2}. The ${1,1} refers to the first capture group in a regex. Click Add indication > Build log. Set the Pattern to match for the test output we've seen in our test execution on the terminal using this regex .*Tests:.*(\d+) failed.*(\d+) total.*. Click Save at the bottom of the page.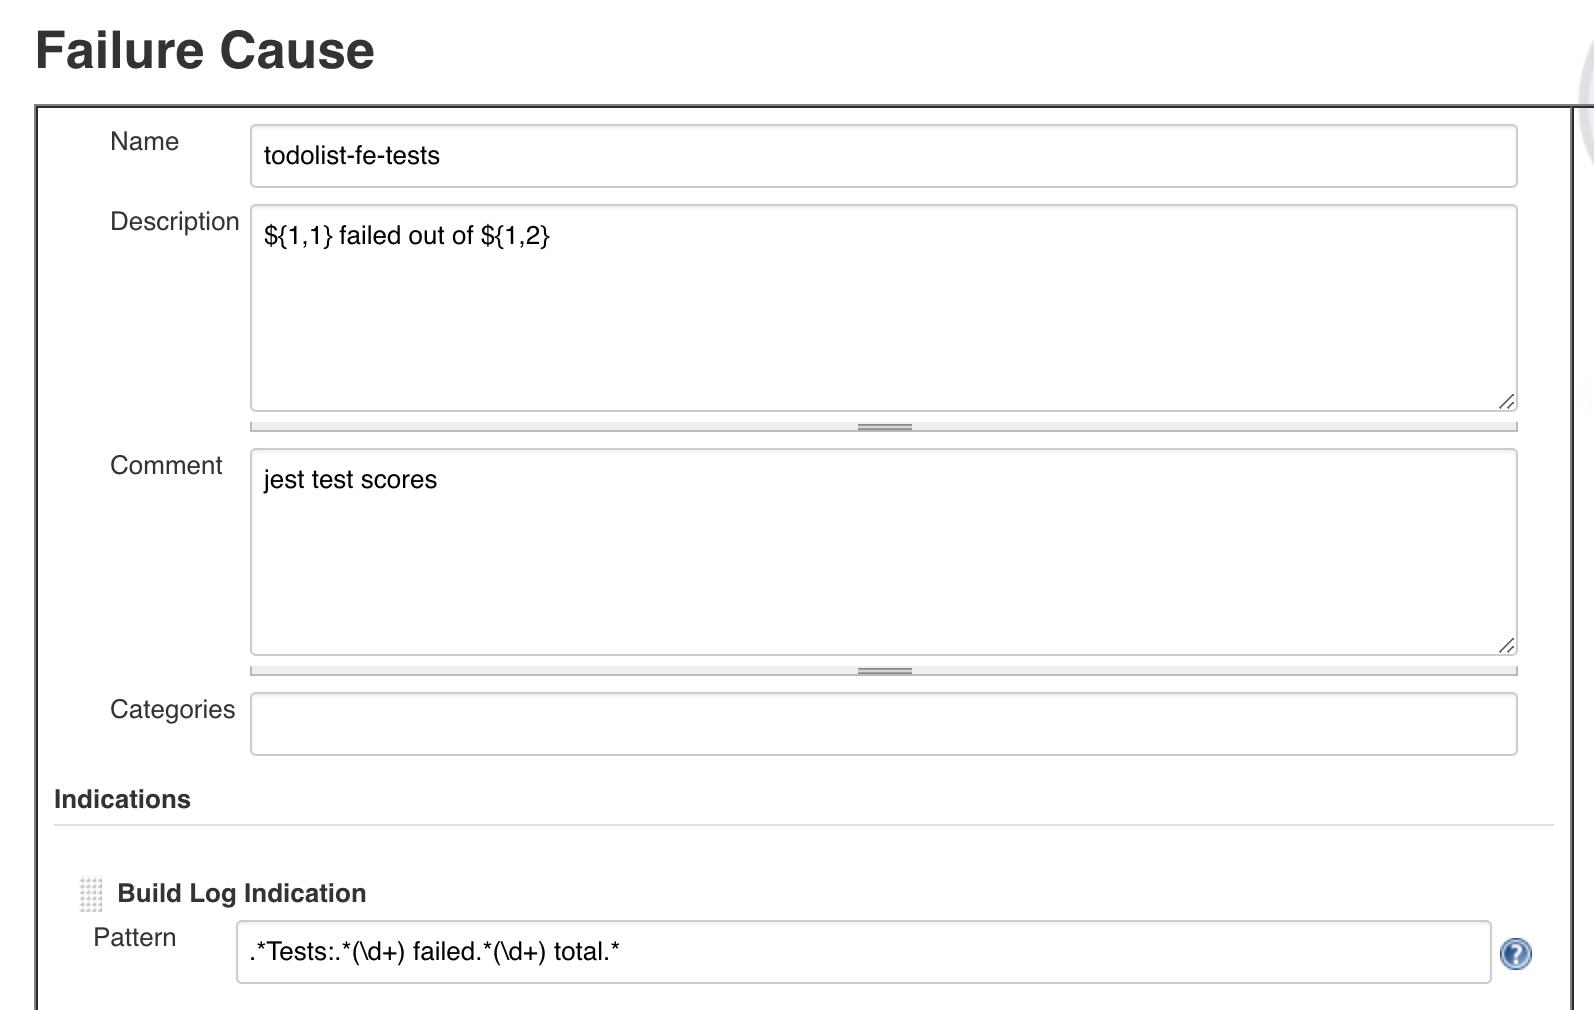
Our dashboards are set to show the Description field from the Build Fail Analyser. Run a build by checking in our failed tests and check the result on the Build Monitor created in the previous stepbash git add . bash git commit -m "TEST - failing build" bash git push 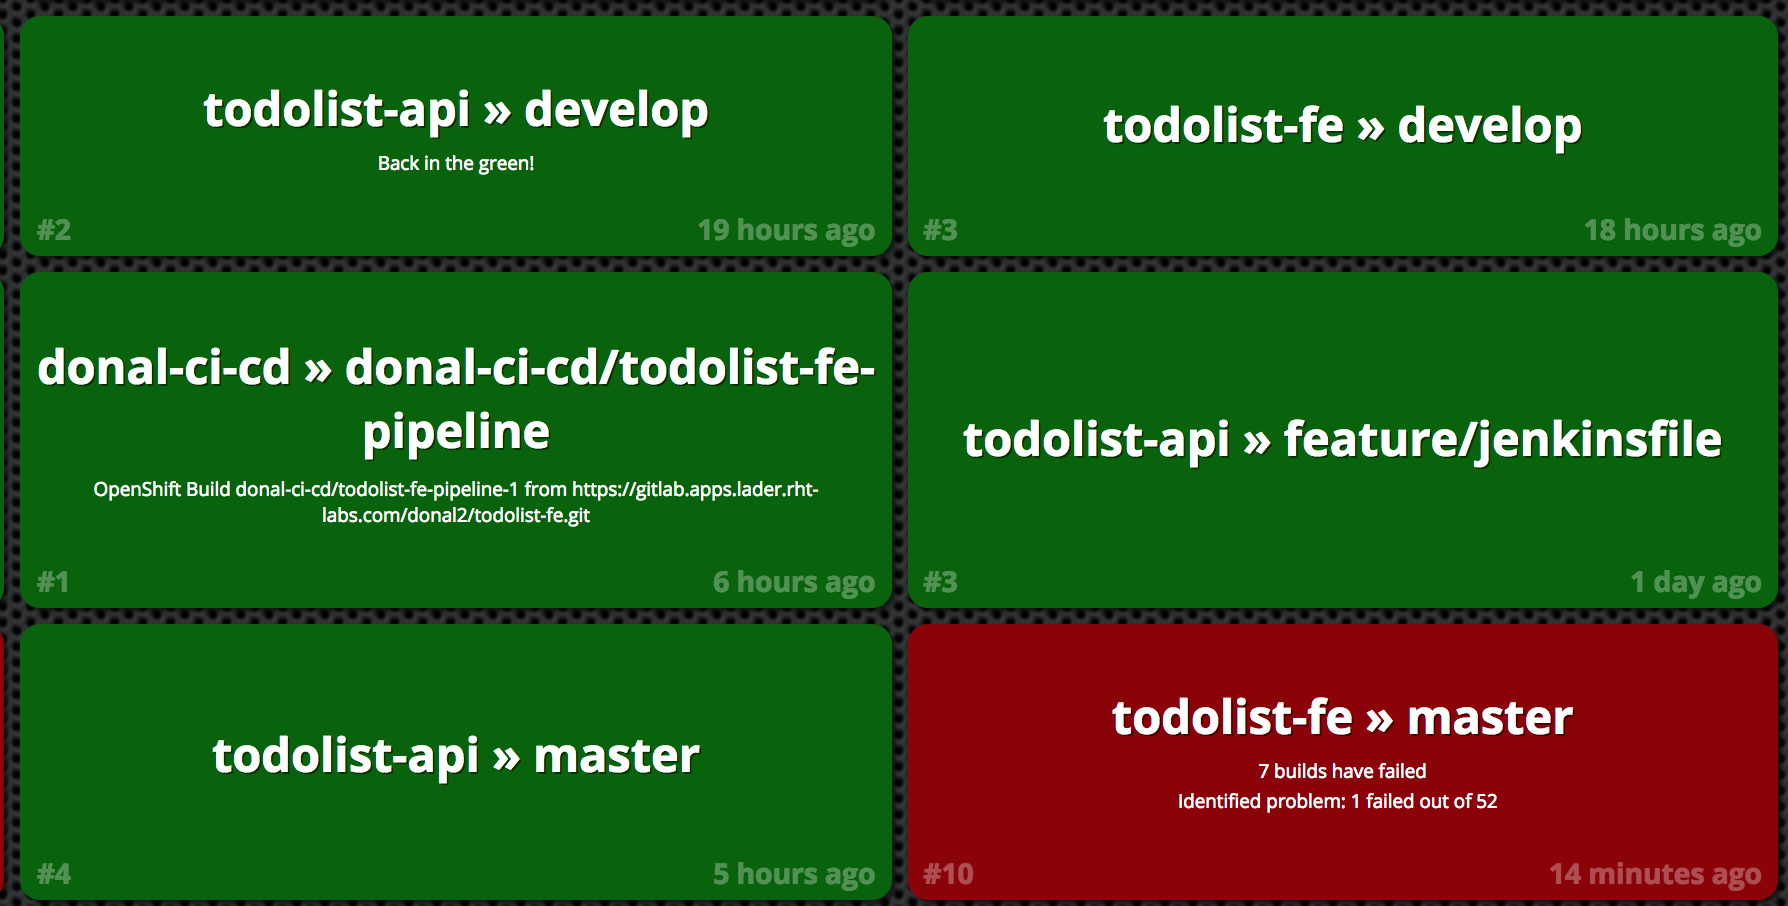
We can save up these regexes and inject them into the jenkins-s2i so the configuration is there the next time we launch and we don't have to code them up again. In enablement-ci-cd repo; the jenkins-s2i/configuration/build-failure-analyzer.xml contains common regex patterns that can be reused.
